I have been a teacher for over 20 years - all the stuff I upload has been tried and tested in my classroom. I don't mind a discussion on Twitter too where I also share new resources. I now have a personal website: https://andylutwyche.com/
I have been a teacher for over 20 years - all the stuff I upload has been tried and tested in my classroom. I don't mind a discussion on Twitter too where I also share new resources. I now have a personal website: https://andylutwyche.com/
All these sheets are available individually for free but if you want to download the lot in one hit then this is for you. These are revision sheets on Data, Algebra, Number, Geometry (hence "DANG"). Each sheet has 6 sections covering the aspects listed in brackets of Data (average, probability, frequency tables, grouped frequency, interpreting bar charts), Algebra (simplifying expressions, solving equations, sequences, y=mx+c, inequalities, substitution), Number (properties of number, BIDMAS, ratio, fractions/percentages, indices, rounding/estimation) and Geometry (measures, angles, perimeter/area/volume, properties of shapes, speed/density, Pythagoras/Trigonometry) up to around B/C or 5/6 grade. All the instructions are on each sheet. Ideal for revision, homework, cover lessons or as a whole class discussion lesson.
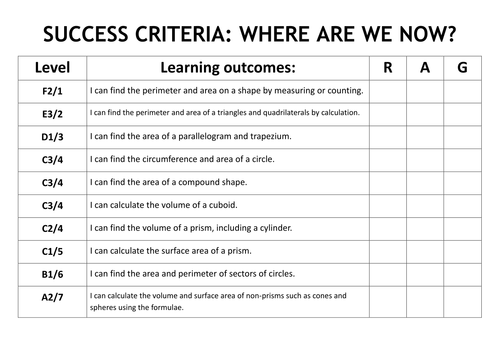
This is a powerpoint covering perimeter, area, volume from simple rectangles, triangles and other quadrilaterals, then going on to surface area including frustums and spheres. It contains brief notes by way of an explanation, model answers to questions and a question or two for the students to do; all of the questions come with answers that you can display when ready. The slide show comes with a progress grid (regularly referred to in the presentation) so that students can mark their progress from start to finish and pinpoint any areas that may need extra work with a “red/amber/green” system that they fill in; each one is given an approximate grade in both new (2017 onwards) and old system in England. It’s what I use in my lessons before setting tasks from worksheets or text books to practise.
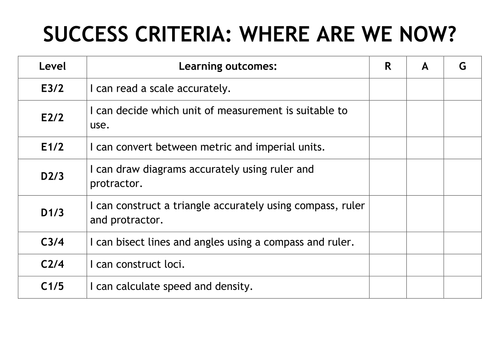
This is a powerpoint covering unit conversions, constructions, loci, speed and density. It contains brief notes by way of an explanation, model answers to questions and a question or two for the students to do; all of the questions come with answers that you can display when ready. The slide show comes with a progress grid (regularly referred to in the presentation) so that students can mark their progress from start to finish and pinpoint any areas that may need extra work with a “red/amber/green” system that they fill in; each one is given an approximate grade in both new (2017 onwards) and old system in England. It’s what I use in my lessons before setting tasks from worksheets or text books to practise.
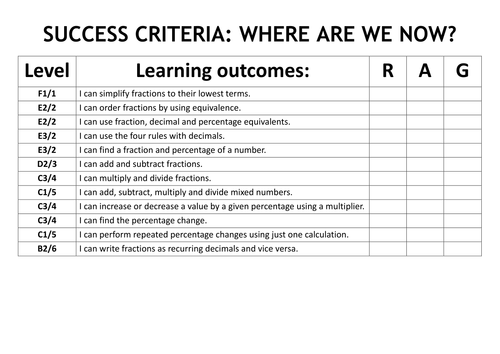
This is a powerpoint covering all aspects of fractions, decimals and percentages including equivalence and calculations. It contains brief notes by way of an explanation, model answers to questions and a question or two for the students to do; all of the questions come with answers that you can display when ready. The slide show comes with a progress grid (regularly referred to in the presentation) so that students can mark their progress from start to finish and pinpoint any areas that may need extra work with a “red/amber/green” system that they fill in; each one is given an approximate grade in both new (2017 onwards) and old system in England. It’s what I use in my lessons before setting tasks from worksheets or text books to practise.
These are all available for free but if you want to save time and get them all then here they are. These are general mathematics questions, not on one specific topic. I have used them at the start of term as a "welcome back" but also, in the case of the Christmas and Easter versions, at the end of term. Each contains a joke punchline to find.
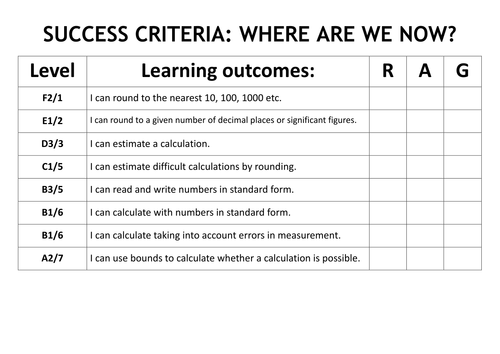
This is a powerpoint covering rounding from to whole numbers, decimal places and significant figures, then estimating calculations (including bounds) to standard form. It contains brief notes by way of an explanation, model answers to questions and a question or two for the students to do; all of the questions come with answers that you can display when ready. The slide show comes with a progress grid (regularly referred to in the presentation) so that students can mark their progress from start to finish and pinpoint any areas that may need extra work with a “red/amber/green” system that they fill in; each one is given an approximate grade in both new (2017 onwards) and old system in England. It’s what I use in my lessons before setting tasks from worksheets or text books to practise.
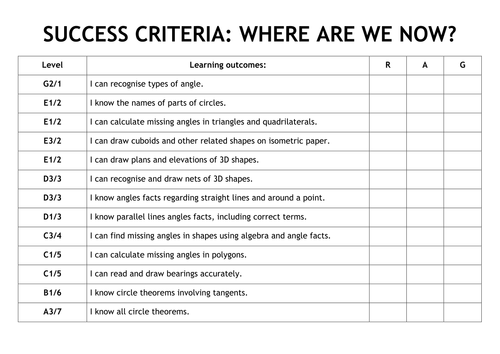
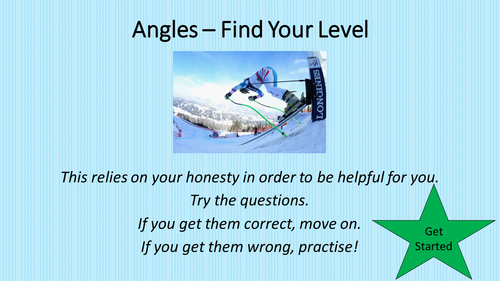
This is a powerpoint covering shapes and their properties, angles facts including circle theorems and bearings. It contains brief notes by way of an explanation, model answers to questions and a question or two for the students to do; all of the questions come with answers that you can display when ready. The slide show comes with a progress grid (regularly referred to in the presentation) so that students can mark their progress from start to finish and pinpoint any areas that may need extra work with a “red/amber/green” system that they fill in; each one is given an approximate grade in both new (2017 onwards) and old system in England. It’s what I use in my lessons before setting tasks from worksheets or text books to practise.
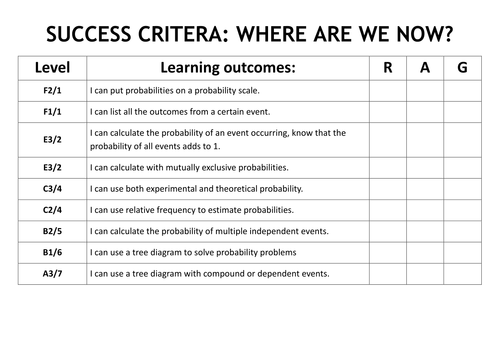
This is a powerpoint covering probability from basic single events to tree diagrams of dependent events. It contains brief notes by way of an explanation, model answers to questions and a question or two for the students to do; all of the questions come with answers that you can display when ready. The slide show comes with a progress grid (regularly referred to in the presentation) so that students can mark their progress from start to finish and pinpoint any areas that may need extra work with a “red/amber/green” system that they fill in; each one is given an approximate grade in both new (2017 onwards) and old system in England. It’s what I use in my lessons before setting tasks from worksheets or text books to practise.
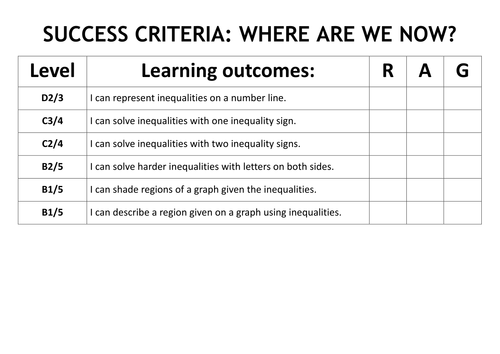
This is a powerpoint covering inequalities from number lines, solving and shading regions. It contains brief notes by way of an explanation, model answers to questions and a question or two for the students to do; all of the questions come with answers that you can display when ready. The slide show comes with a progress grid (regularly referred to in the presentation) so that students can mark their progress from start to finish and pinpoint any areas that may need extra work with a “red/amber/green” system that they fill in; each one is given an approximate grade in both new (2017 onwards) and old system in England. It’s what I use in my lessons before setting tasks from worksheets or text books to practise.
These are all available for free but if you haven’t the time to search for them then here they are. I find these useful for short homeworks, starters or plenaries and if the answer doesn’t appear then they need to check theirs!
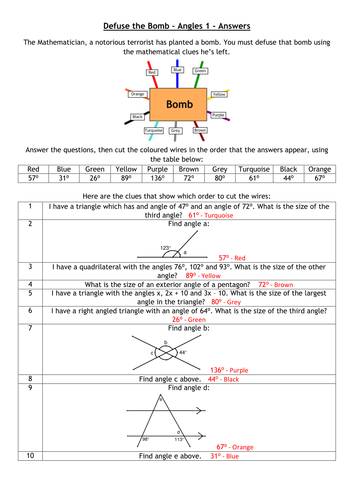
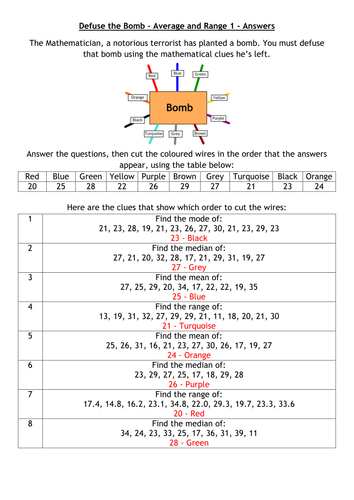
These are all available individually for free but are available as one big bunch here. The concept is to choose the correct order to cut the wires by answering the questions correctly - each wire is linked to a question. Not all the wires need cutting to prevent guessing at the end. I use these as starters, plenaries (prove you can do the work tasks) and quick homeworks!
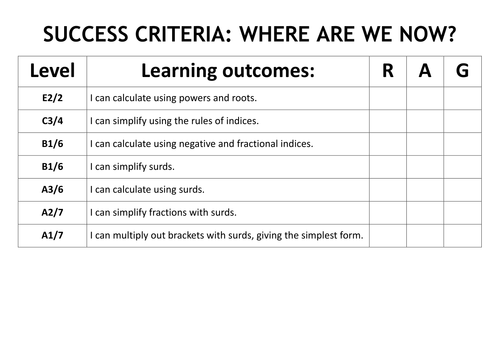
This is a powerpoint covering rules of indices and simplifying before moving on to surds including simplifying, calculating and rationalising denominators. It contains brief notes by way of an explanation, model answers to questions and a question or two for the students to do; all of the questions come with answers that you can display when ready. The slide show comes with a progress grid (regularly referred to in the presentation) so that students can mark their progress from start to finish and pinpoint any areas that may need extra work with a “red/amber/green” system that they fill in; each one is given an approximate grade in both new (2017 onwards) and old system in England. It’s what I use in my lessons before setting tasks from worksheets or text books to practise.
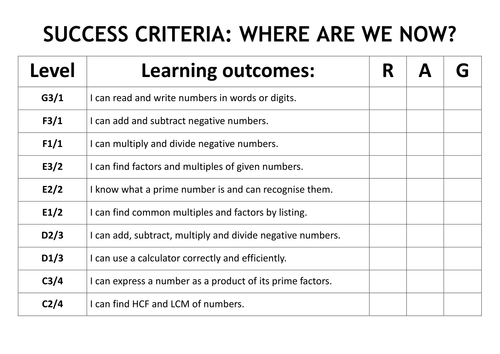
This is a powerpoint covering muliples, factors, primes, HCF, LCM before going on to directed/negative numbers. It contains brief notes by way of an explanation, model answers to questions and a question or two for the students to do; all of the questions come with answers that you can display when ready. The slide show comes with a progress grid (regularly referred to in the presentation) so that students can mark their progress from start to finish and pinpoint any areas that may need extra work with a “red/amber/green” system that they fill in; each one is given an approximate grade in both new (2017 onwards) and old system in England. It’s what I use in my lessons before setting tasks from worksheets or text books to practise.
This is a powerpoint covering expanding single and double brackets and factorising into single and double brackets. It contains brief notes by way of an explanation, model answers to questions and a question or two for the students to do; all of the questions come with answers that you can display when ready. The slide show comes with a progress grid (regularly referred to in the presentation) so that students can mark their progress from start to finish and pinpoint any areas that may need extra work with a “red/amber/green” system that they fill in; each one is given an approximate grade in both new (2017 onwards) and old system in England. It’s what I use in my lessons before setting tasks from worksheets or text books to practise.
This is a powerpoint covering sequences from continuing, using the nth term, finding the nth term and briefly covering quadratic sequences. It contains brief notes by way of an explanation, model answers to questions and a question or two for the students to do; all of the questions come with answers that you can display when ready. The slide show comes with a progress grid (regularly referred to in the presentation) so that students can mark their progress from start to finish and pinpoint any areas that may need extra work with a “red/amber/green” system that they fill in; each one is given an approximate grade in both new (2017 onwards) and old system in England. It’s what I use in my lessons before setting tasks from worksheets or text books to practise.
A progress sheet to print out, questions on various topics to check knowledge and focus revision in the places where it's needed. This starts at measuring and drawing, types of angle (G/1), on a line/around a point (F/1), triangles and quadrilaterals (E/2), parallel lines (D/3), polygons (C/4), bearings (C/4&5) and circle theorems (A/7&8).
A progress sheet to print out, questions on various topics to check knowledge and focus revision in the places where it's needed. This starts at symmetry (G/F/1), moves onto reflection, rotation, translation, enlargement without a centre (all D/3), enlargement with a centre (C/5), combined transformations (B/6), Congruence and similarity (B/6) and area and volume of similar shapes (A/7).
This is a powerpoint covering simplifying expressions along with forming and using formulae. It contains brief notes by way of an explanation, model answers to questions and a question or two for the students to do; all of the questions come with answers that you can display when ready. The slide show comes with a progress grid (regularly referred to in the presentation) so that students can mark their progress from start to finish and pinpoint any areas that may need extra work with a “red/amber/green” system that they fill in; each one is given an approximate grade in both new (2017 onwards) and old system in England. It’s what I use in my lessons before setting tasks from worksheets or text books to practise.
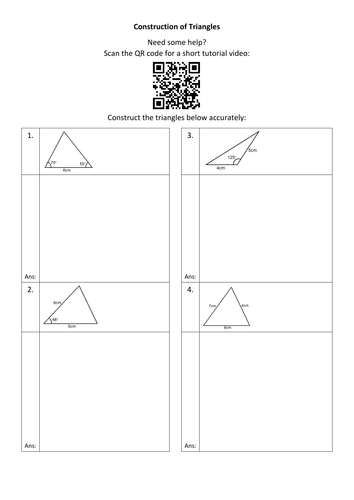
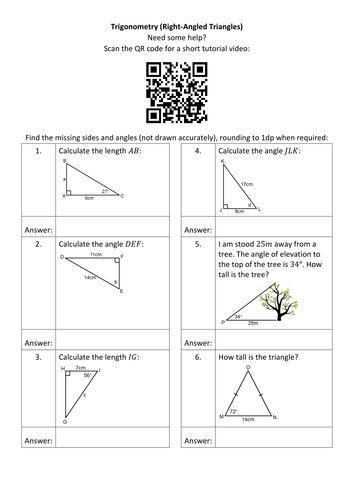
This is a booklet of 22 worksheets that can be used for either revision, homework or those students who have missed work with each containing a QR code that will scan to a short tutorial video. It is designed to cover the entire GCSE geometry curriculum. I have tried to order the sheets in a logical way, although not necessarily in "difficulty" order, the topics are grouped. These are the Word files so they can be edited to your own preference.
This is a booklet of 20 worksheets that can be used for either revision, homework or those students who have missed work with each containing a QR code that will scan to a short tutorial video. It is designed to cover the entire GCSE geometry curriculum. I have tried to order the sheets in a logical way, although not necessarily in "difficulty" order, the topics are grouped. These are the Word files so they can be edited to your own preference.