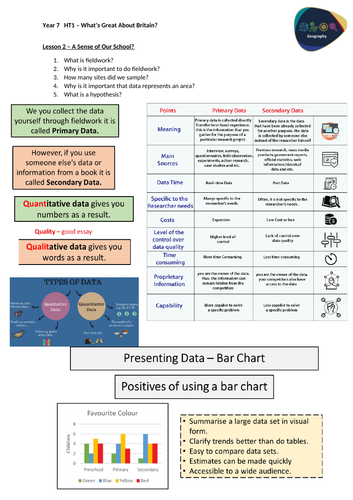


Students will be able to describe the difference between Primary and Secondary data as well as give examples for each type. Then students will investigate Quantitative versus Qualitative data and what types of data these represent. Finally students will explain why it is important to display data in different methods, specifically bar chart. This lesson was created to be part of a two lesson plan, so the previous lesson will be included in the download to help with planing.
Starter: Knowledge Retention on previous learning
Task 1: Testing the difference between primary and secondary data
Task 2: Testing the difference between quantitative and qualitative
Task 3: Why do we choose to present data in a certain way?
Task 4: Main Task: Describe the quality of the environment at our school
Lesson contains two powerpoints and one worksheet.
Something went wrong, please try again later.
This resource hasn't been reviewed yet
To ensure quality for our reviews, only customers who have purchased this resource can review it
Report this resourceto let us know if it violates our terms and conditions.
Our customer service team will review your report and will be in touch.