Flowcharts
Subject: Computing
Age range: 14-16
Resource type: Worksheet/Activity
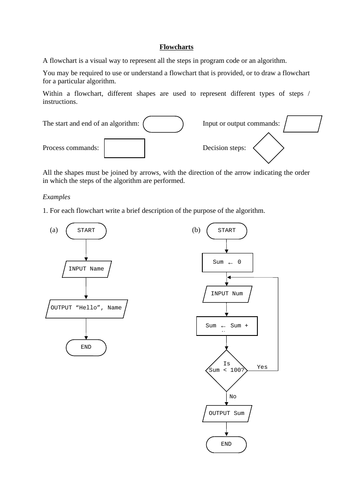


This 12-page resource introduces how flowcharts can be used as a visual representation of a program, tailored towards the iGCSE Computer Science course.
After introducing the different shapes used for different types of steps or instructions, there are some examples to work through as a group, followed by an exercise for pupils to attempt themselves.
Solutions to the exercise are included, and solutions to the examples are included in the teacher version.
Something went wrong, please try again later.
This resource hasn't been reviewed yet
To ensure quality for our reviews, only customers who have purchased this resource can review it
Report this resourceto let us know if it violates our terms and conditions.
Our customer service team will review your report and will be in touch.