


Numeracy based lesson focussing upon the growth of the largest megacities.
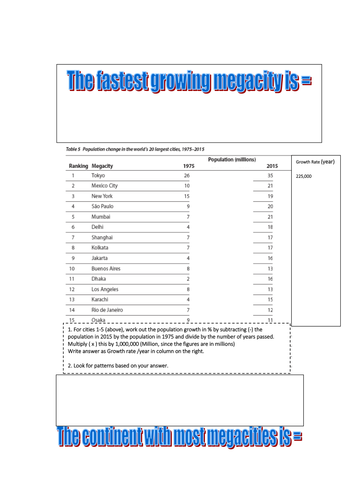
Students calculate the growth rate of megacities between 1975 and 2015. Students can then plot the megacities of 1975 in one colour and 2015 in another, to draw a comparison between both years.
Differentiated numeracy sheets.
Assessment
A3 map for plotting, and a series of differentiated planning grids to support students with their interpretation and explanation.
Something went wrong, please try again later.
This resource hasn't been reviewed yet
To ensure quality for our reviews, only customers who have purchased this resource can review it
Report this resourceto let us know if it violates our terms and conditions.
Our customer service team will review your report and will be in touch.
£3.00