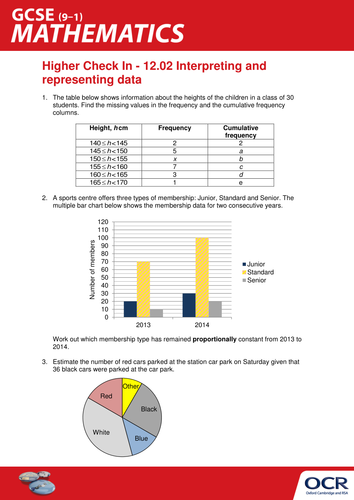
A 10 question test on Interpreting and representing data, comprising: 5 questions on procedural calculations; 3 questions on reasoning and communicating mathematically; and 2 problem solving questions. At the end of the test there is an extension activity which will allow more able students to stretch themselves. This resource is ideal for either formative or summative assessment and can be used in lesson time as a topic assessment, starter or plenary activity or for homework or revision.
Topics include:
Categorical and numerical data:
Interpret and construct charts appropriate to the data type; including frequency tables, bar charts, pie charts and pictograms for categorical data, vertical line charts for ungrouped discrete numerical data.
Interpret multiple and composite bar charts.
Design tables to classify data.
Interpret and construct line graphs for time series data, and identify trends (e.g. seasonal variations).
Grouped data:
Interpret and construct diagrams for grouped data as appropriate, i.e. cumulative frequency graphs and histograms (with either equal or unequal class intervals).
Visit Teach Cambridge for more resource ideas.
Something went wrong, please try again later.
A valuable way in to the topic. Thank you for sharing freely.
Report this resourceto let us know if it violates our terms and conditions.
Our customer service team will review your report and will be in touch.
