
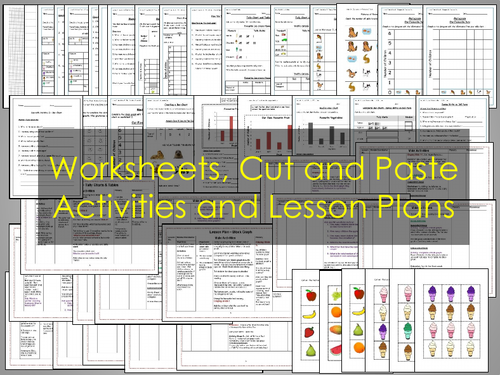

This resource contains data and graphing relating to pictograms, bar charts, block graphs and tally charts and tables. It also includes lesson plans, PowerPoint presentations and worksheet activities.
In line with the NC 2014 - Making and using pictograms, tally charts, block diagrams and simple tables.
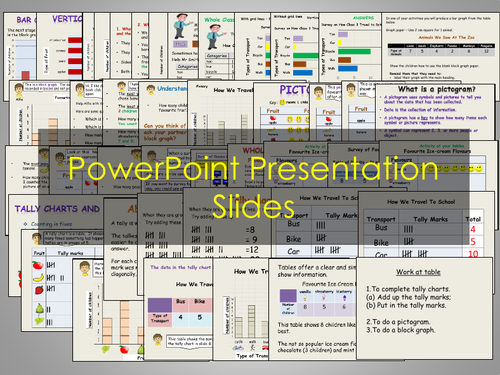
There is a PowerPoint Presentation on each lesson.
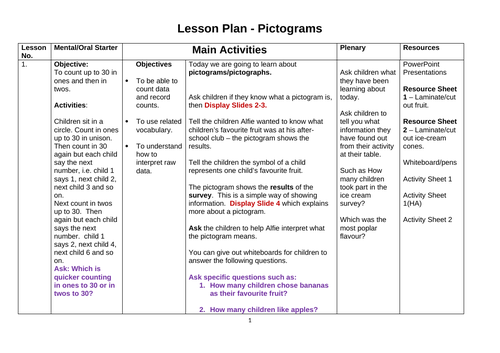
Lesson Plans contain:-
Oral/Mental Starters
Main activities
Plenaries (Recap session)
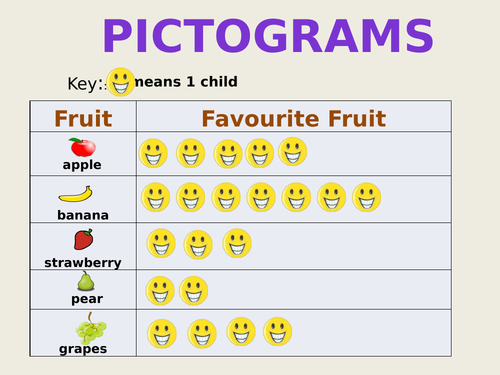
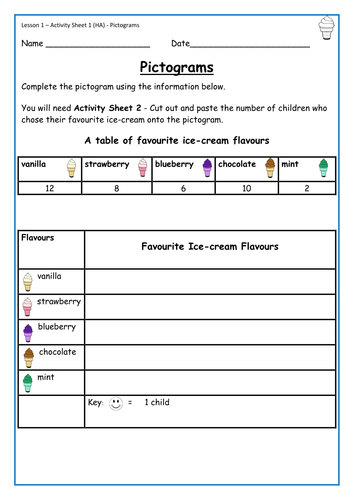
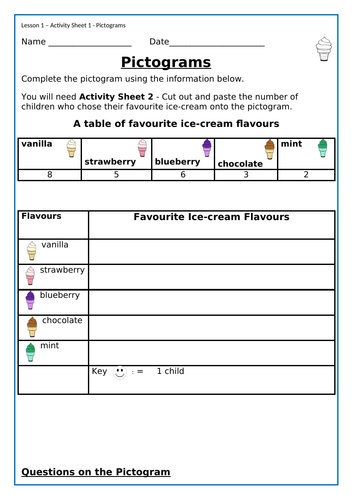
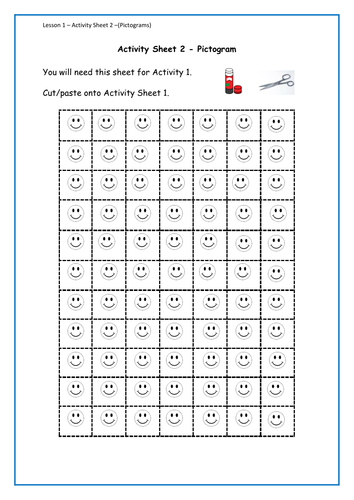
Lesson Plan 1: Pictograms - Children read and create pictograms - Differentiated worksheet activities and question sheets.
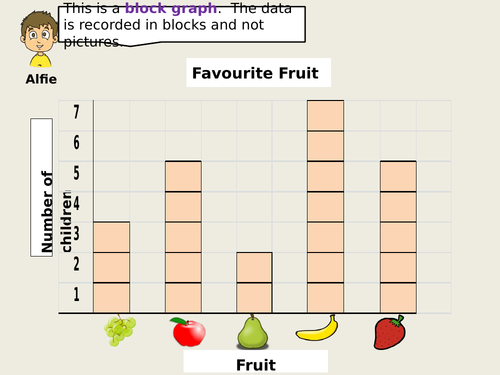
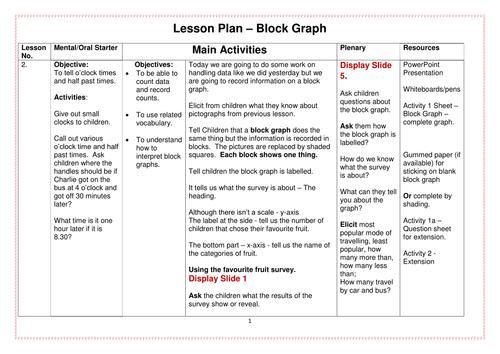
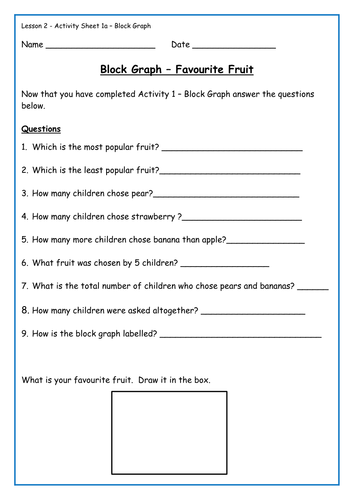
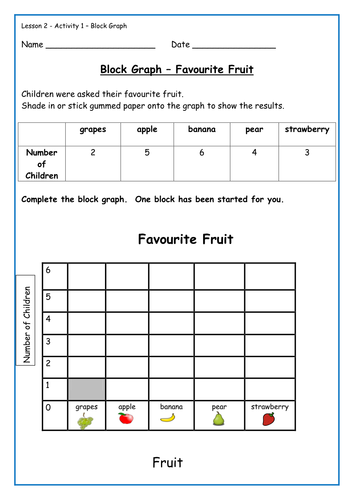
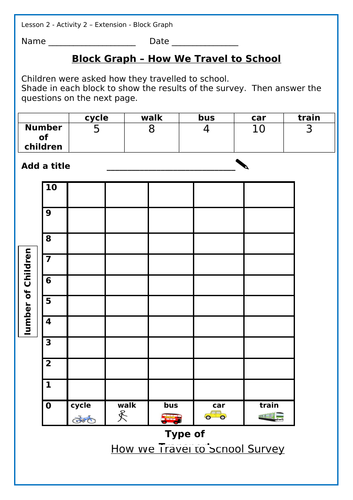
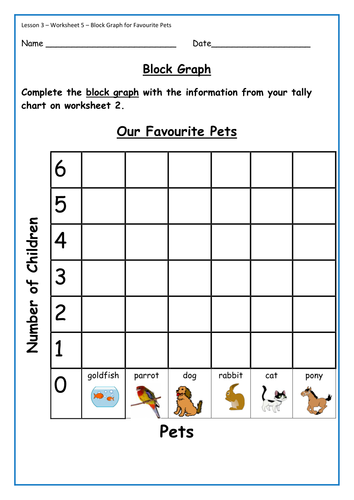
Lesson Plan 2: Children create and read block diagrams- worksheet activities on block graphs and question sheets.
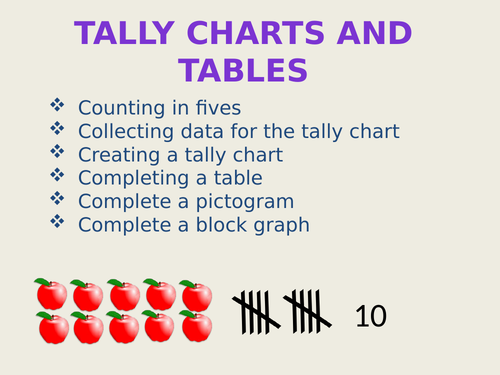
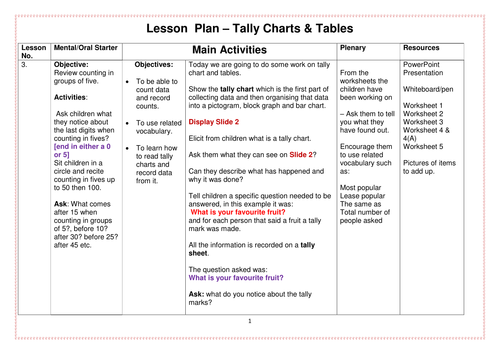
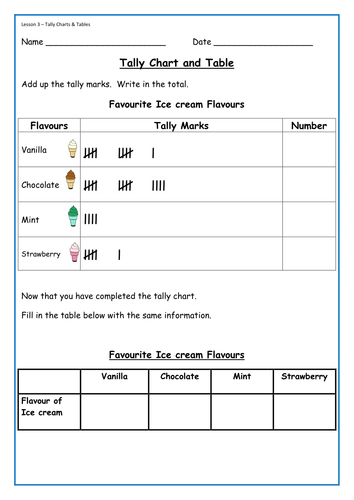
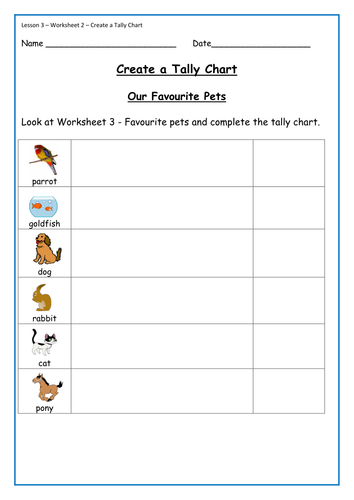
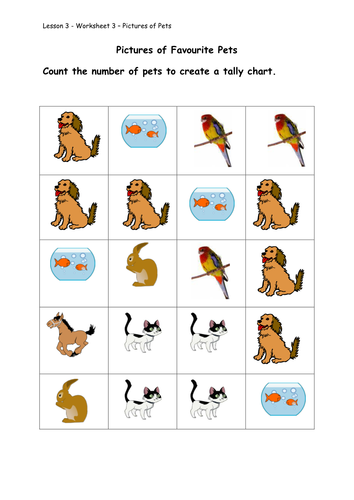
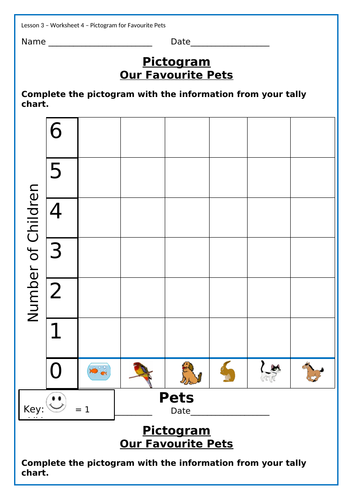
Lesson Plan 3: Children read and create tally Charts and data tables. Children will incorporate what they have learnt so far tally and read tables in order to create a pictogram and block graph. - Differentiated worksheet activities.
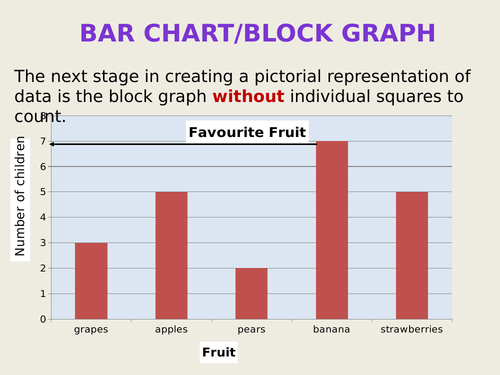
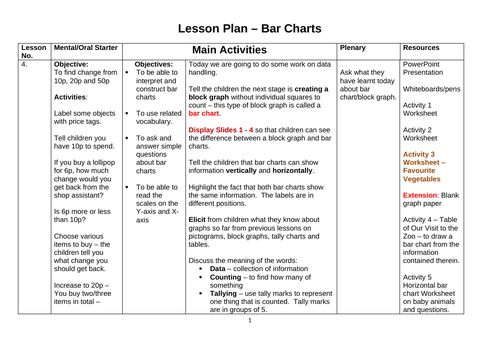
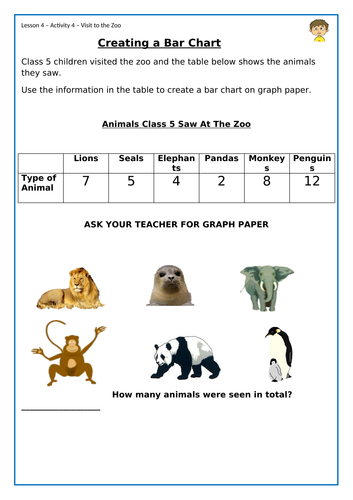
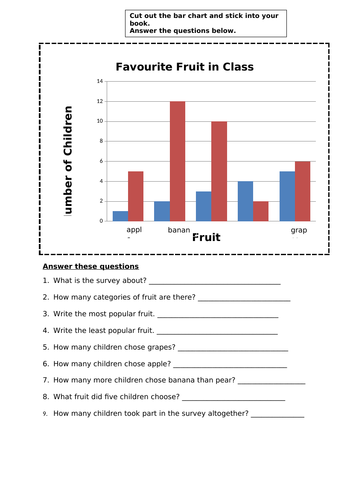
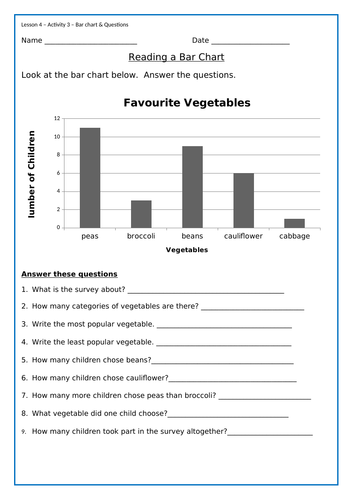
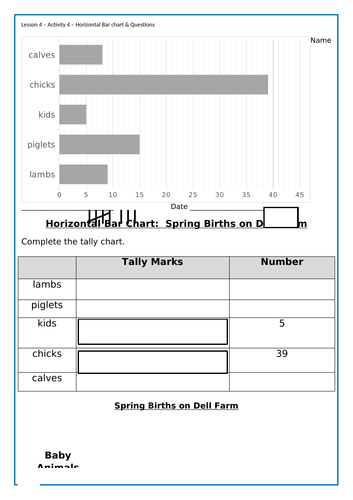
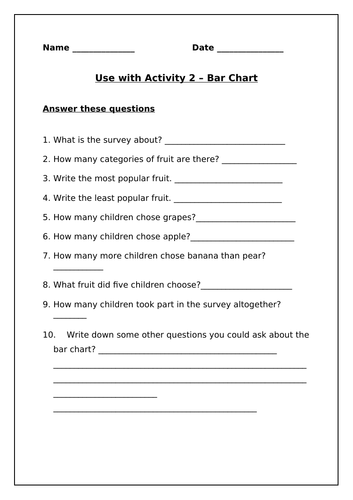
Lesson Plan 4: Bar Charts (vertical and horizonal) - Children read and answer questions on bar charts and learn to interpret them; produce a bar chart from a table - Zoo Animals.
Surveys on Favourite Fruit, Flavours of Ice cream, Favourite Pets , How Children Travel to School and Favourite Vegetables.
Worksheets and Presentations are editable and printable.
Resources 1 and 2 - Best to print off, laminate and cut out for repeated use.
Now includes PDF versions.
You may be interested in:
St. Valentine-themed Data Handling Resources: Tally Charts, Tables, Pictograms, Block Graphs, Bar Charts , Presentations, Worksheets and Activities
Something went wrong, please try again later.
We are pleased to let you know that your resource Pictograms Block Graphs Bar Charts Tally Charts Tables Presentations Worksheets, has been hand-picked by the Tes resources content team to be featured in https://www.tes.com/teaching-resources/blog/primary-maths-statistics in May 2024 on https://www.tes.com/teaching-resources/blog. Congratulations on your resource being chosen and thank you for your ongoing contributions to the Tes Resources marketplace.
Report this resourceto let us know if it violates our terms and conditions.
Our customer service team will review your report and will be in touch.
£3.85