
Uses macros. Choose ‘enable macros’ to use this workbook.
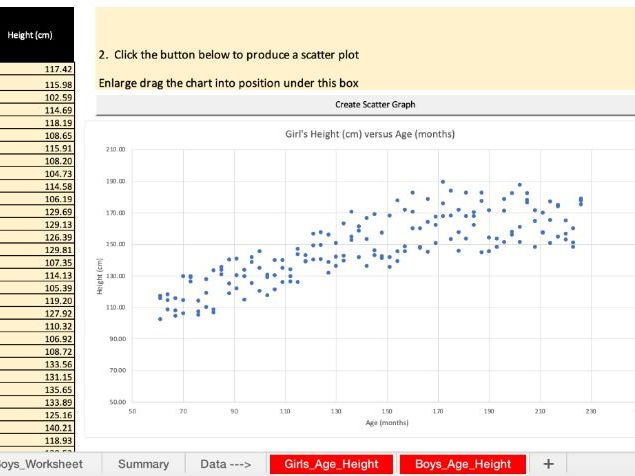
This workbook encourages students to analyse real-world data using scatter graphs and lines of best-fit.
The workbook is based off of real world (publically available) WHO data on (average) boys and girls height (cm) versus age (months). Students are guided through noticing that an initially linear relationship falters.
They are encouraged to comment on their findings and compare the results for boys and girls.
Something went wrong, please try again later.
This resource hasn't been reviewed yet
To ensure quality for our reviews, only customers who have downloaded this resource can review it
Report this resourceto let us know if it violates our terms and conditions.
Our customer service team will review your report and will be in touch.
£0.00