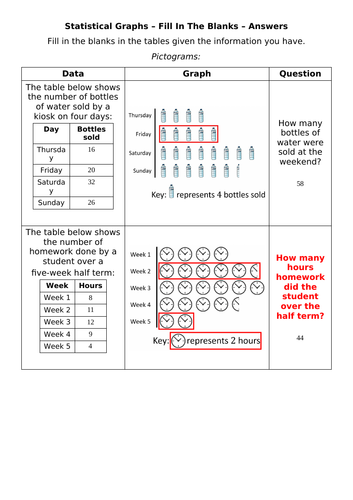


This looks at basic statistical diagrams: pictograms, bar charts and pie charts.
There are four pages, one for each of the above and the final one being the same data represented by all three charts mentioned, but with bits missing on each.
For each there are blanks to be filled, plus a question on the data.
The idea is to get the students working forwards and backwards, not just getting stuck in a rut of doing the same thing repeatedly.
Something went wrong, please try again later.
This resource hasn't been reviewed yet
To ensure quality for our reviews, only customers who have downloaded this resource can review it
Report this resourceto let us know if it violates our terms and conditions.
Our customer service team will review your report and will be in touch.
£0.00