


Interactive powerpoint and spreadsheet to demonstrate and calculate the following statistical functions required for A Level Biology:
Standard Error
Standard Deviation
Chi-Squared for ecological studies
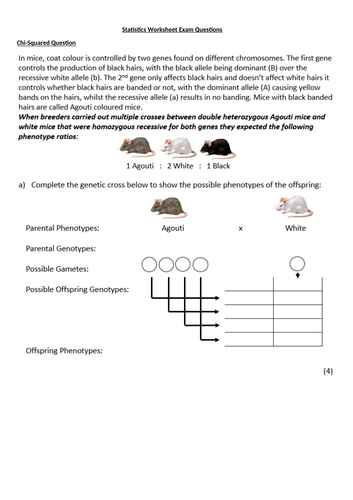
Chi-Squared for phenotype ratios
Student’s t-test for unpaired data
Student’s t-test for paired data
Spearman’s Ranked Coefficient of Correlation
Where degrees of freedom and p=0.05 confidence levels are used they are automatically calculated from the inputted data and an indication is shown as to whether a null hypothesis for the data is to be accepted or rejected.
The power point goes step by step through each statistical test, describing how to use it, how to calculate each one and what the results mean.
The work sheet contains exam style questions and answers upon chi-squared which is covered with a step by step explanation at the end of the power point.
A watermarked preview video if the ppt can be found at https://youtu.be/1LcW3EO0MpU
Something went wrong, please try again later.
Report this resourceto let us know if it violates our terms and conditions.
Our customer service team will review your report and will be in touch.
£2.00