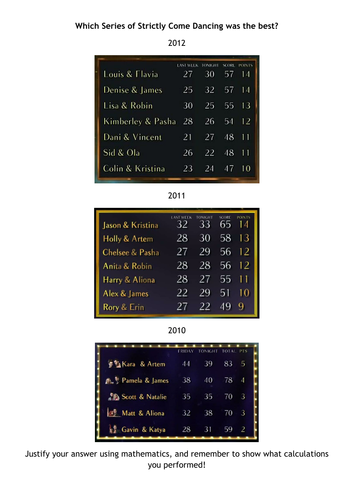


Use statistical calculations to justify which was the best series of Strictly Come Dancing based upon the scoreboards shown.
Something went wrong, please try again later.
This resource has been selected to feature in the TES Secondary Maths Newsletter. Thank you so much for sharing, you are helping to inspire teachers and students all over the world!
This is a nice resource which requires pupils to calculate some averages in order to decide 'which series was the best'. They could go on to draw some graphs to illustrate their findings. This is ideal for low ability KS3 as a short project, given the data is discrete it's not appropriate for higher level but you could still use it as a starter perhaps. Thank you for sharing.
Report this resourceto let us know if it violates our terms and conditions.
Our customer service team will review your report and will be in touch.
£0.00