130Uploads
932k+Views
1076k+Downloads
Math

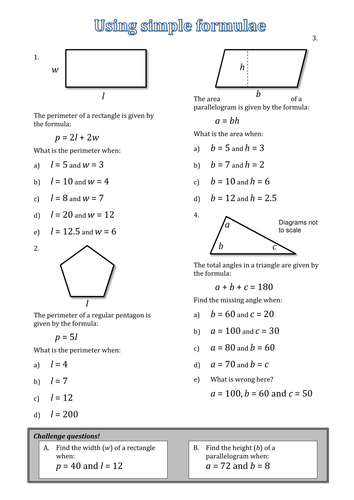
Substitute in simple formulae
'Quick' worksheet with perimeter of rectangle and pentagon, area of parallelogram and angles in a triangle. Four questions on each.For brighter Y6 (starting algebra) but also for lower ability secondary.

Sequences - using/finding nth term - scaffolded
Use nth term rule and find nth term for linear expressions (2-sided worksheet for each). Worksheets scaffolded. First with missing terms and second to find multiplier and difference between that times table and the sequence given.\n\nNot a lot different to exercises in books but hopefully attractive and less intimidating (limited number of questions!) for a lower ability group.

Mean - missing data and combined data
Find the missing number given mean and other numbers. Find mean of combined data sets.\n\nCould use with mini-whiteboards as each step animated.\n\n(16/6/14 added WALT and starter)

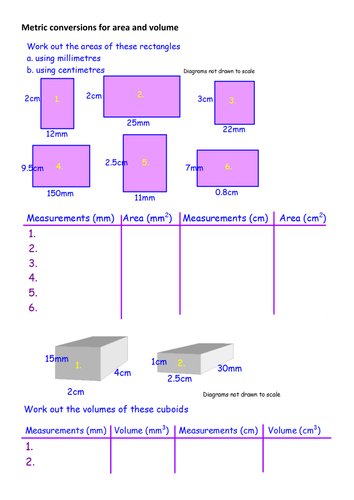
Metric conversions for area and volume
Straight-forward examples for area/volume using mixed units for length. Can they see relationship?

Multiplying and dividing by powers of ten
Two main slides showing visually place value adjustment when multiplying/dividing by 10, 100, 1000. Plus puzzle starter. You may just want to use the two main slides in a PowerPoint of your own!

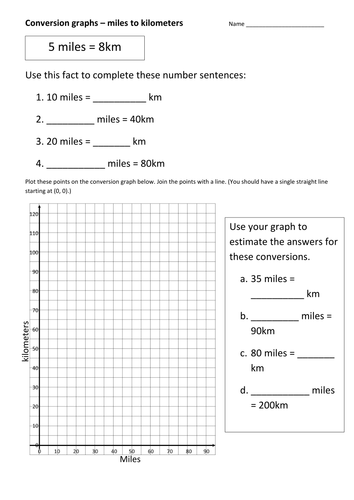
Draw and interpret conversion graph - miles to km
Scaffolded worksheet asking students to find 4 points, plot these on a conversion graph of miles to km and then use the line to convert 4 other values. (10/2/14) Two further examples added.

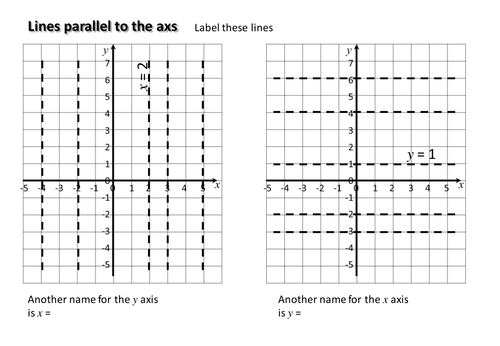
Reflections in named lines: KS3 / KS4 Math
First worksheet is a starter getting learners to name lines like x=2 and y=1. (It is assumed this has been covered previously.) Second worksheet asks students to draw reflections in named lines. (It is assumed they have drawn reflections in general before.)

Demonstration of surface area & volume of solids
Promethean flipcharts demonstrating surface area and volume of solids. Versions for ActivInspire (Flipchart) and ActivStudio 3.5 (Flp).

Percentage increase and decrease 'demo'
Promethean flipchart demonstrating percentage increase and decrease. Authored in ActivStudio 3.5 but should import into ActivInspire.

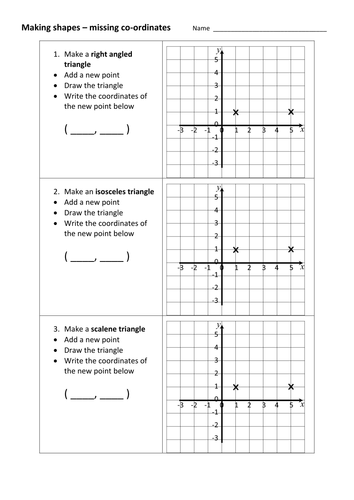
Make 2-D shapes from missing coordinates
Find the coordinates that creates the required shape - some of the problems have more than one answer. Others (assuming you use integer values and stay on the grid) do not. Various triangles, square, parallelogram, rhombus, trapezium.\n\nFinal page to identify given shapes - named, congruent, enlargement.

Transformations summary quiz
Flash card (or other) quiz as summary or check-in for 4 basic transformations. 10 Qs. Centre rotation/enlargement not covered or vector form for translation.

Solve equations with two unknowns
Set out algebraically (rather than using picture puzzles). Finding solutions with limits (eg. only positive integers). Challenge questions are (implicitly) simultaneous. Used with bright Y6 group.

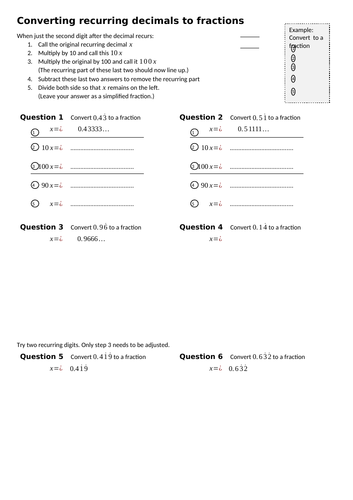
Recurring decimals to fractions - scaffolded
Scaffolded worksheet for converting decimal with second or second/third digit from decimal recurring.

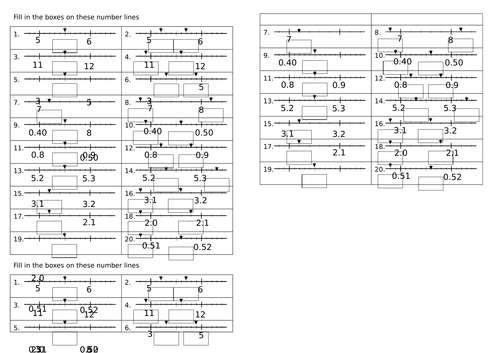
Place value - use scales to find intermediate decimal values
20 quick questions. Use scale on left to get middle value (eg. between 5 and 6) or to establish the increments on the scale. 2nd question, fill in two more values on scale on right based on that answer. Repeat x 10. (Most increments are 10, but some are just five 'per unit'. One, two and 3 decimal places.)

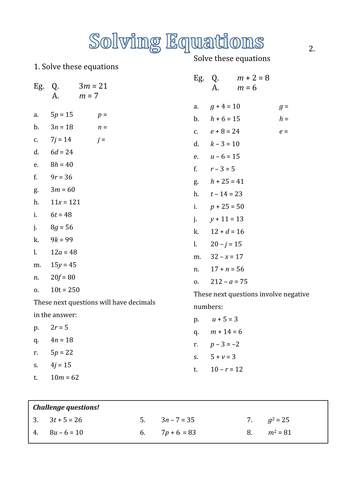
Solve 1-step equations
Mainly simple '1-step' equations, but some with negative or fractional answers

Trial and improvement - square and cube roots
Relatively simple, structured worksheet on using trial and improvement to find square and cube roots to 1 decimal place using second d.p. (Can ignore latter and just find closest to 1 d.p.) 7/3/14 Slightly improved versions replacing originals and another new 'problem'.

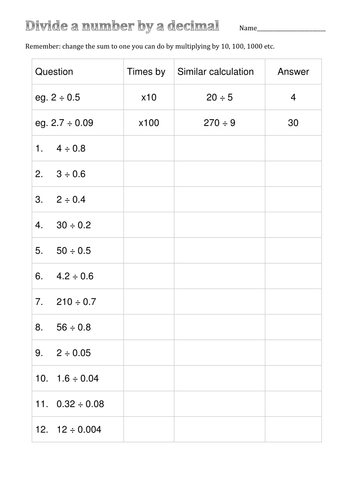
Dividing by a simple decimal
Structured worksheet for dividing by a simple decimal. Uses principle of finding a similar calculation that gives the same answer - so instead of 36 / 0.09, find 3600 / 9.
(12/7/16) Answers uploaded

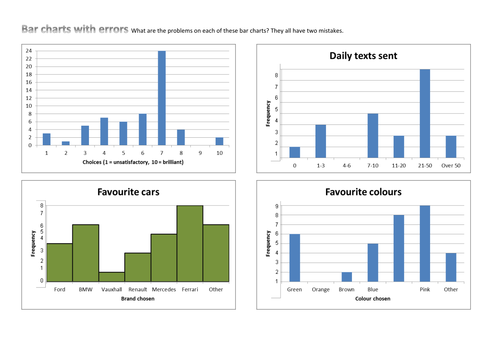
Averages from bar chart
Extract discrete data from a bar chart and use to find mean, median, mode and range. Starts by considering a table of data and then two examples of bar charts.

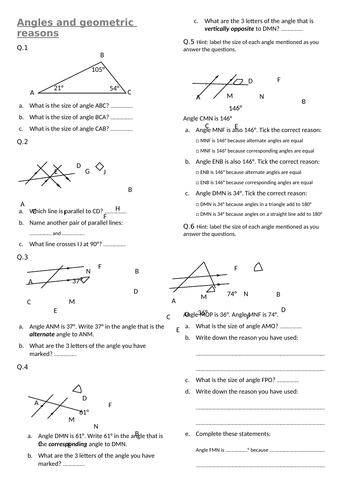
Angles and geometric reasons - intro
Fill-in worksheet introducing correct way to name angles/lines and identifying alternate/corresponding angles. Goes on to get students to identify and then write correct geometric reasons.
Answer sheet to match (although student sheet slightly reconfigured since to give correct names for angles).
Meant as a reasonably easy introductory resource once key ideas have been explained from the board. Hopefully accessible to my Y7s (Yup!)
Second worksheet (with answers) emphasises reasons for each angle

