


Recent
Most read
Most shared

The curriculum is our collective means of securing the knowledge and skills needed by the next generation to thrive individually while advancing our society.
The content is therefore crucial, but often controversial. And judgement calls on content can be difficult given the wealth of collective knowledge and finite curriculum time.
The independent curriculum and assessment review is tasked with ensuring that young people can access a broad and balanced curriculum.
We have promised to be rigorously evidence- and data-informed. As such, it has been important to investigate patterns of subject take-up and curriculum dedication over time.
The data shows some interesting trends, and a more nuanced picture than is often assumed. See the graphs below.
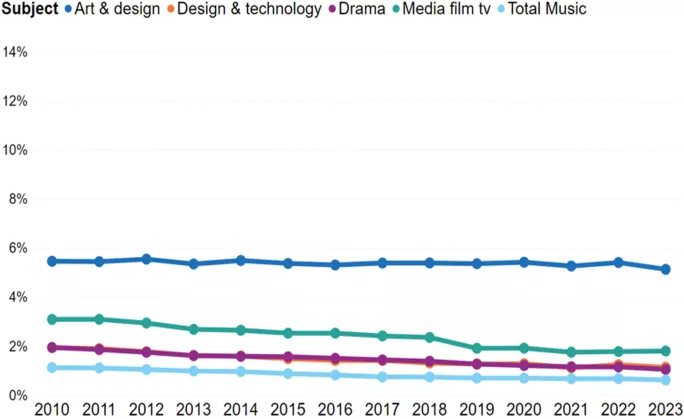
Figure 1: GCSE entries by subject, as a proportion of all pupils at the end of key stage 4, 2009/10 to 2022/23
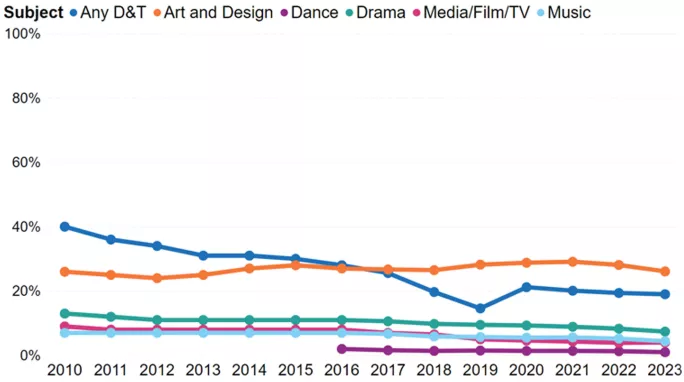
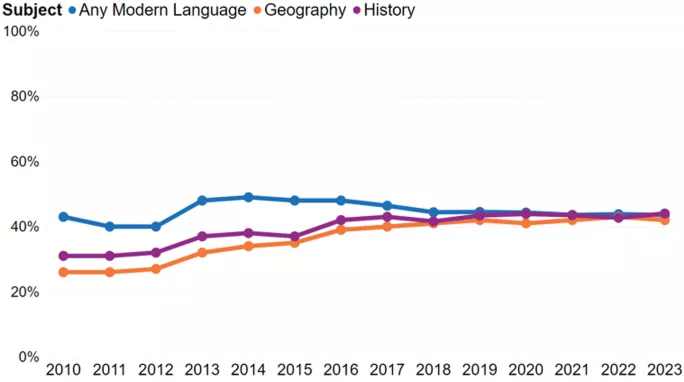
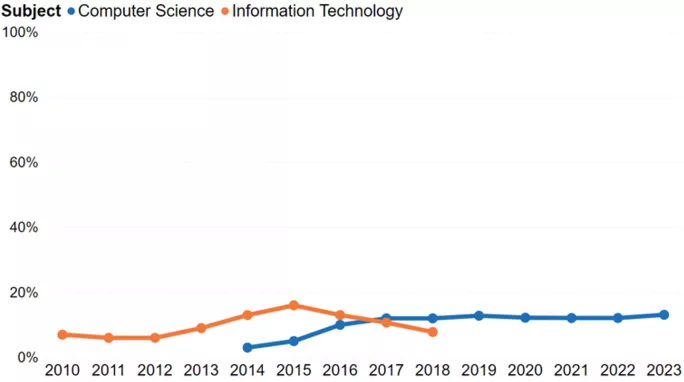
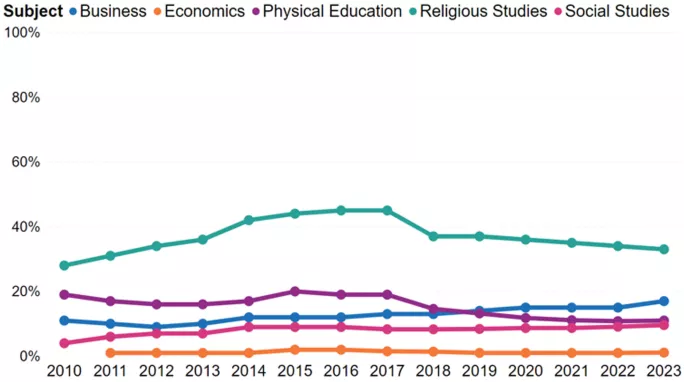
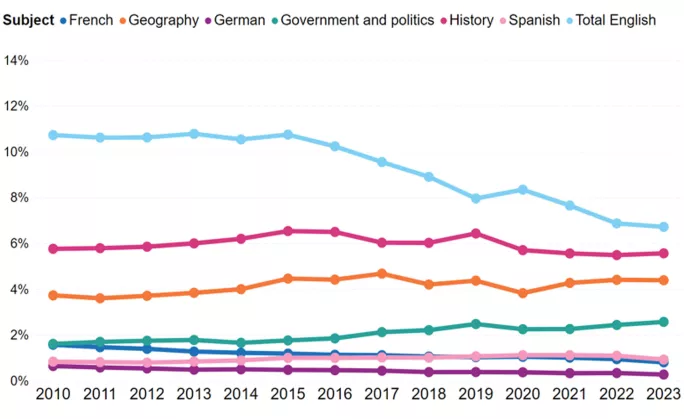
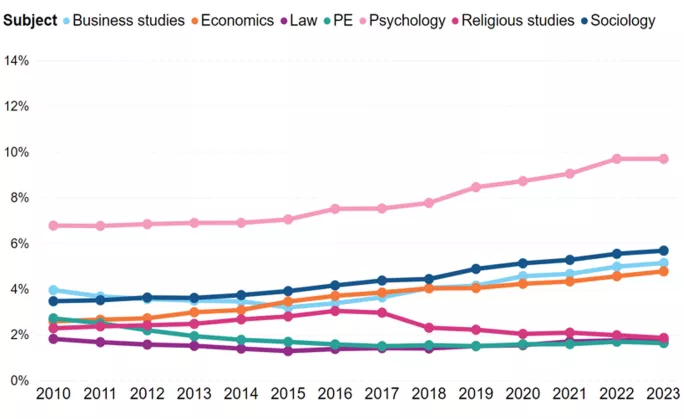
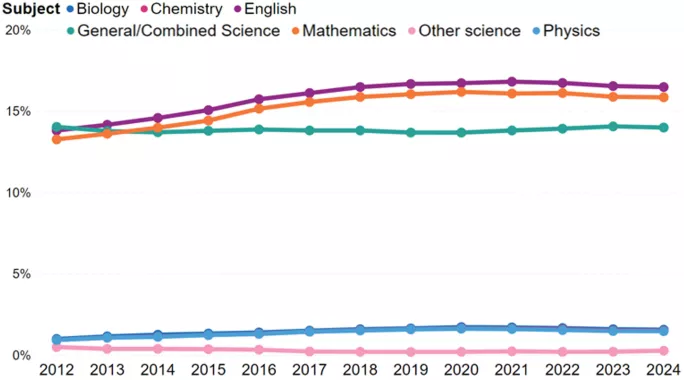
Figure 2: A-level entries by subject, as a proportion of all A-level entries, 2009/10 to 2022/23
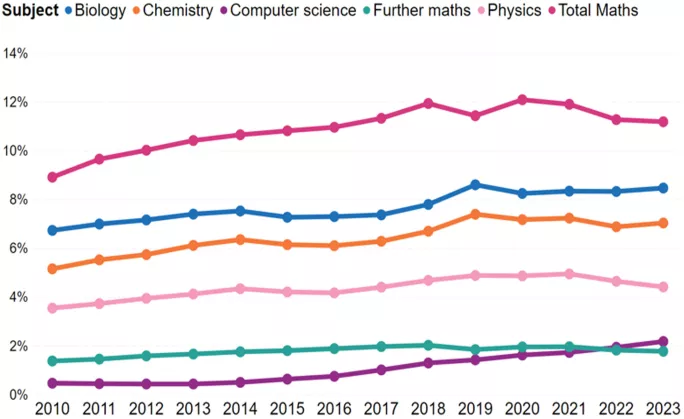
There has been a trend towards significantly higher numbers of young people taking maths A level - and, indeed, a slight increase in the uptake of Stem subjects at A level across the board. This reflects the successful delivery of long-term policy objectives to support Stem subjects and their engagement by young people.
There has been a very slight decline in arts subjects at A level, but this doesn’t match the steeper uptake for Stem. Instead, we see a more complex picture, with more significant declines in other areas such as English.
At GCSE, we can see that history and geography have a strong uptake, potentially reflecting their inclusion in the English Baccalaureate measure. Religious studies also remains popular at GCSE, despite not featuring in the EBacc.
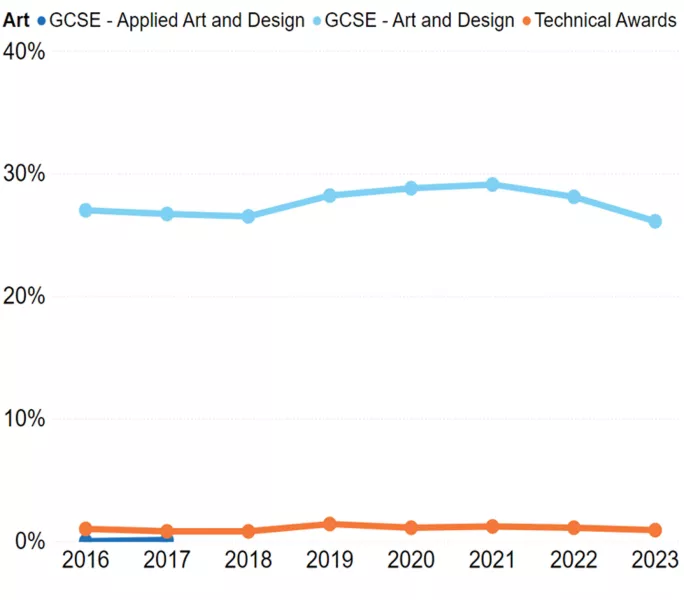
Meanwhile, art and design as a subject continues to thrive at GCSE: it remains among the most popular subjects for take-up. In contrast, some subjects within the category ‘the arts’ have seen a decline: notably drama, and (to a lesser extent) music. However, design and technology stands out as the subject that has fared worst over time.
These patterns are complicated even further by vocational qualifications: 43 per cent of young people take a technical award at key stage 4 as a GCSE equivalent. And some of these vocational qualifications comprise arts subjects.
Looking at technical awards and GCSEs together, we see the following trends at KS4.
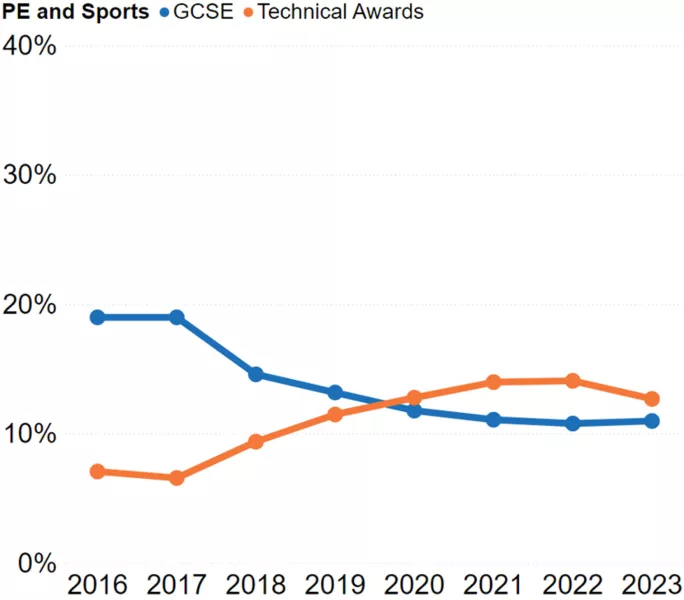
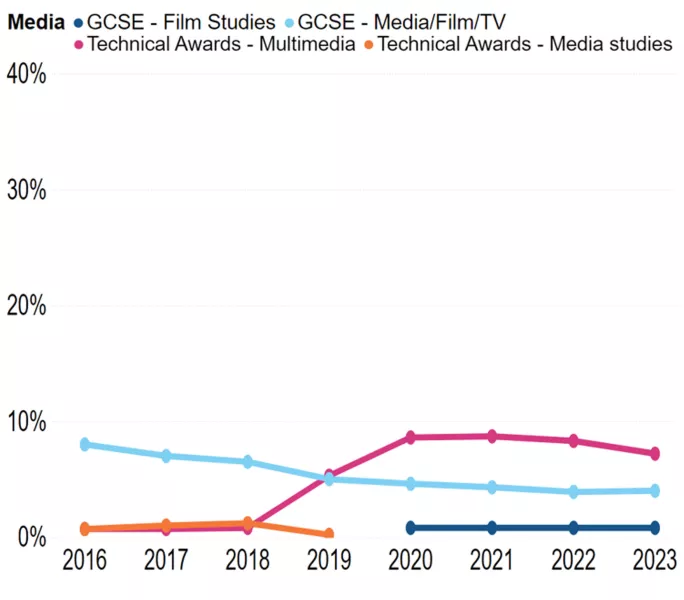
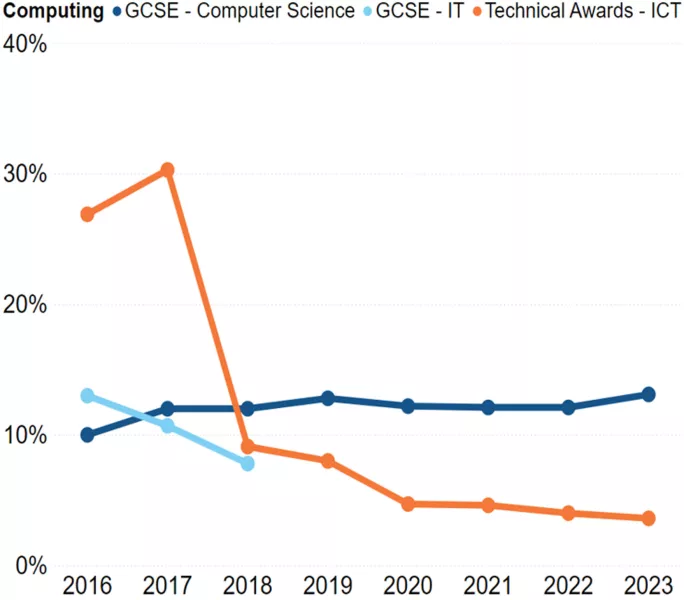
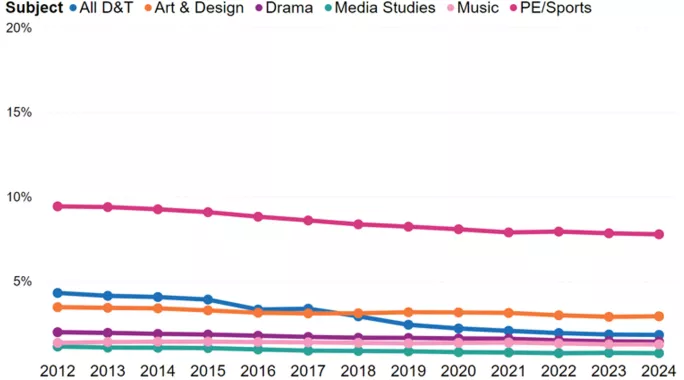
Figure 3: Proportion of pupils at the end of KS4 entering GCSEs or technical awards in music; PE and sports subjects; art; media/film/TV subjects; drama; and computing and ICT
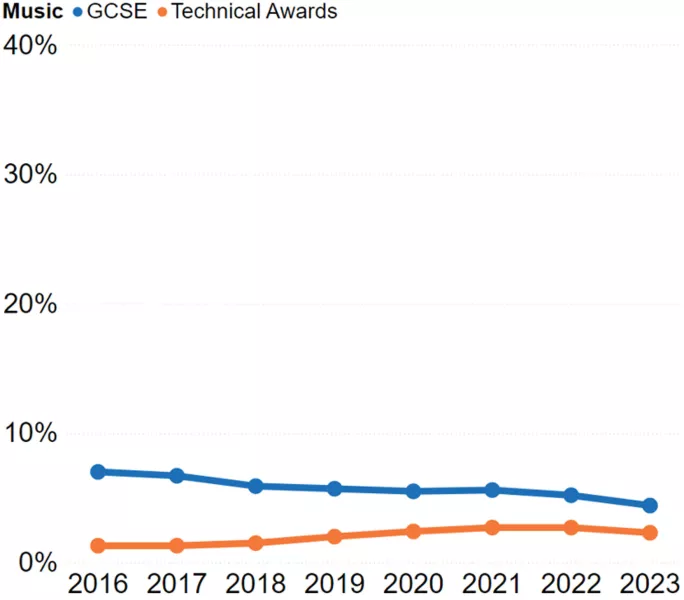
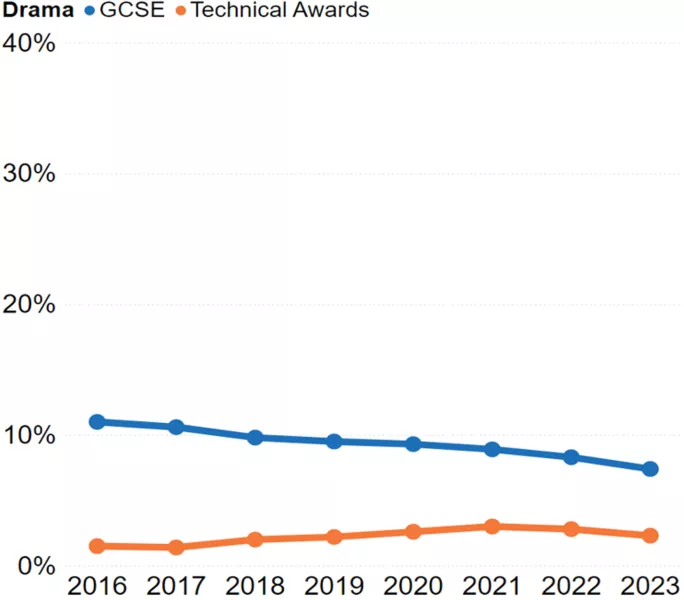
While these do not reverse the trends noted above, they mediate them.
For example, while the proportion of pupils entering music GCSEs has declined from 7 per cent in 2016 to 5 per cent in 2022, we have seen an increase in entries into technical awards in music from 1 per cent to 3 per cent over the same period, before entries to both fall slightly in 2023.
There were also similar patterns in drama and media, and for PE/sports, where the proportion of pupils taking technical awards had overtaken GCSEs by 2020.
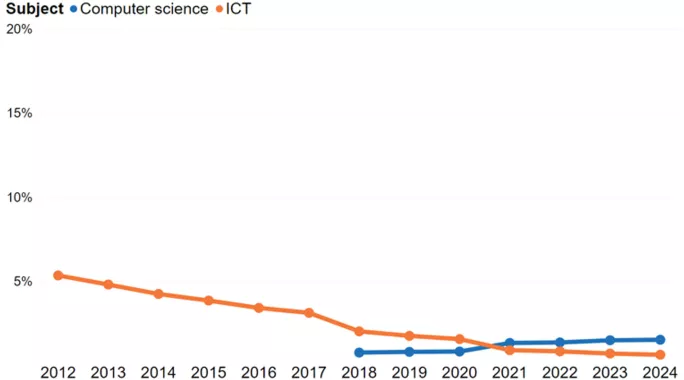
If we return to Figure 1, we see that some other subjects either have low uptake, or uptake has declined substantially in recent years. For example, computing has seen a significant reduction in uptake, especially for female entry - this is since the introduction of the computer science GCSE and the withdrawal of alternative qualifications.
A focus on dedicated curriculum time raises further issues.
The School Workforce Census Guide records the number of hours that are taught for each subject. The chart below shows each subject group as a proportion of the overall teaching time given to a curriculum subject.
Note that these taught hours include both teacher and teaching assistant time.
Figure 4: Teaching time by subject groups, as a proportion of total teaching time for years 10 and 11
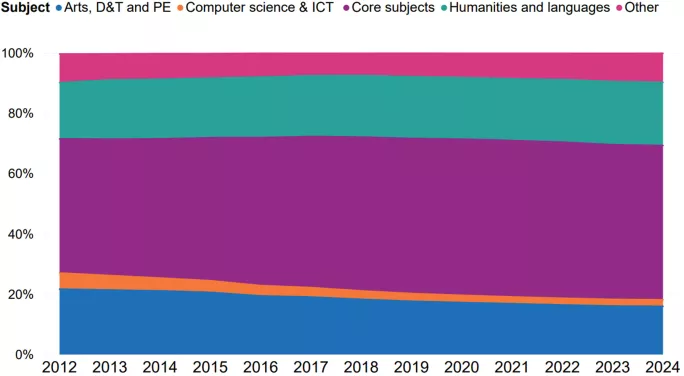
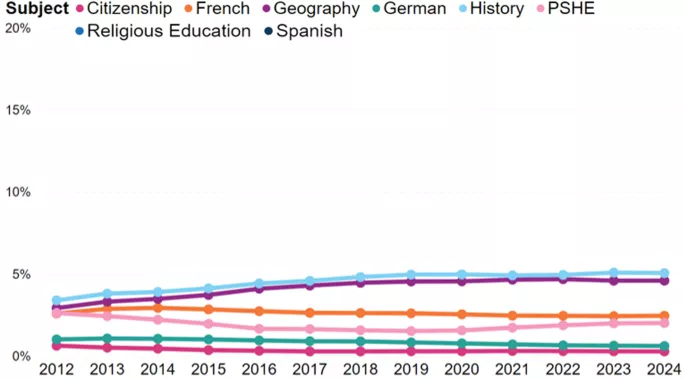
Figure 5: Teaching time by subject, as a proportion of total teaching time for years 10 and 11
While the teaching time for maths and English has expanded, we can see time pressure on some other subjects, including PE.
PE is part of the national curriculum and schools have a statutory obligation to teach it, yet we see a decline in dedicated time at KS4. Likewise, relationships and sex education (RSHE), and citizenship, have had time further squeezed.
We hope that sharing this information aids our evidence-led conversation as we consider curriculum breadth and balance.
The graphs above are courtesy of the Department for Education.
Professor Becky Francis is chair of the curriculum and assessment review and on secondment from her role as CEO of the Education Endowment Foundation. This article first appeared as a blog on the Department for Education website.