 Quick View
Velocity Time Graphs
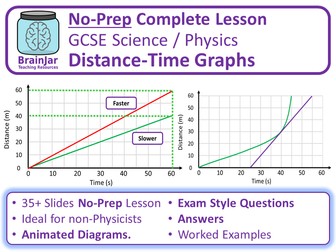
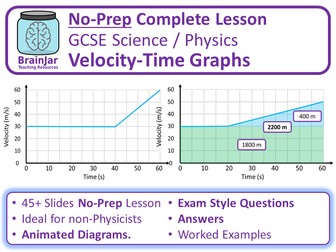
<p><strong>Complete No-Prep lesson</strong> with <strong>exam questions, tasks and answers</strong> on velocity time graphs for AQA GCSE (9-1) Science / Physics. This lesson covers part of AQA GCSE Physics 4.5.6.1.5 / Combined Science 6.5.4.1.5.</p>
<p>As a Secondary Science teacher, Deputy Headteacher, writer and examiner for many years I make high quality <strong>no-prep</strong> lessons so busy teachers can teach <strong>outstanding lessons without spending hours planning.</strong> This high quality lesson includes explanations, different types of in-lesson assessment (all <strong>with answers</strong>) and <strong>unique exam questions</strong>.</p>
<p>My lessons are <strong>ideal for non-Physicists</strong> - as a Biologist who retrained as a Physics teacher I know how to take learners on a journey that builds up their understanding step by step, while still going into a lot of depth. The <strong>preview video</strong> shows a representative sample of slides from the resource so that you get a good idea of what it includes before you buy.</p>
<p><strong>What’s Included:</strong><br />
• Teaching notes<br />
• Starter / Do Now Activity<br />
• Explanation slides in “chunked” sections with <strong>animated diagrams</strong>.<br />
• Worked examples of calculations / questions.<br />
• Multiple questions in different question styles and difficulties - no need for worksheets. Each “chunked” explanation section typically includes a set of “<strong>learning check / quick questions</strong>” followed by a set of <strong>in-depth questions</strong> on the learning from that “chunk” of the lesson. All questions have <strong>answers</strong>.<br />
• <strong>Exam-style questions</strong> on the whole lesson at the end of the lesson- these are unique, based on real exam questions but not just copied from exam boards.<br />
• <strong>Answers</strong> for all questions<br />
• All easily editable to adapt to your teaching or to use in existing lessons.<br />
• Slightly humorous, at points, if you like that sort of thing.</p>
<p>The lesson was written for AQA GCSE Science / Physics but is very likely to be applicable to other exam specifications.</p>
<p>Please leave a rating / review and all other feedback gratefully received!</p>