In this resource we cover the AP statistics 6.2 which is focused on constructing a confidence interval for the population proportion.
Topics Covered
• Population vs sample proportion
• Confidence interval formula
• Margin of error and its interpretation
• Z-critical values (z*)
• Conditions for inference
• Standard error of sample proportion
• Sample size determination
• Interpreting confidence intervals correctly
• Special cases and applications
• Common mistakes and exam traps
What Students Will Learn
• What a hypothesis test for a proportion is and when to use it
• How to correctly define:
✔ Population proportion §
✔ Sample proportion (p̂)
✔ Hypothesized value (p₀)
• How to identify and use a one-sample z-test for proportions
• The meaning of the p-value and how it is interpreted
• How to set up hypotheses correctly:
✔ H₀: p = p₀
✔ Hₐ: p > p₀, p < p₀, or p ≠ p₀
• How to determine the correct direction of the test
• How to check all required conditions:
✔ Random
✔ Independence (10% condition)
✔ Normality (np₀ ≥ 10 and n(1 − p₀) ≥ 10)
Topics Covered
• One-sample z-test for proportions
• Understanding p-values
• Setting up null and alternative hypotheses
• Right-tailed, left-tailed, and two-tailed tests
• Conditions for valid inference
• Step-by-step test setup process
• Fully worked examples
• Common mistakes and exam traps
Topics Covered
• Using confidence intervals to evaluate claims
• Interpreting interval position (inside / outside)
• Logical reasoning with inequalities
• Meaning of confidence level
• Sample vs population understanding
• Comparing confidence intervals
• Effect of confidence level on width
• Effect of sample size
• Common misconceptions and exam traps
Topics Covered
• Hypothesis testing framework
• Type I error (α)
• Type II error (β)
• Power of a test
• Relationship between α, β, and power
• Factors affecting power:
✔ Sample size
✔ Significance level
✔ Effect size
✔ Standard error
• Trade-offs between errors
• Real-world examples (medical, quality control, etc.)
• Relationship between p-value and errors
• Common misconceptions and exam traps
What Students Will Learn
✔ What a p-value actually represents
✔ How to correctly interpret p-values in context
✔ The connection between p-value and statistical significance
✔ How to make correct evidence-based conclusions
✔ Common mistakes students make (and how to avoid them)
Topics Covered
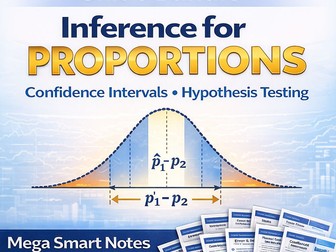
• Confidence intervals for (p₁ − p₂)
• Correct vs incorrect interpretations
• Meaning of confidence level
• Using intervals to test claims
• Role of zero in the interval
• Direction of difference
• Relationship between confidence intervals and hypothesis testing
• Estimating p-value ranges using intervals
• Step-by-step reasoning strategy
• Common mistakes and exam traps
Topics Covered
• Difference in population proportions (p₁ − p₂)
• Two-sample z-interval formula
• Standard error calculation
• Margin of error
• Conditions for inference
• Step-by-step methodology
• Interpreting results in context
• Comparing two groups
• When the method is NOT appropriate
• Common mistakes and exam traps
Topics Covered
• Two-sample z-test for proportions
• Test statistic formula
• Pooled proportion calculation
• P-value interpretation
• One-tailed vs two-tailed tests
• Decision rules (reject / fail to reject H₀)
• Full hypothesis testing process
• Worked examples
• Common mistakes and exam traps
Topics Covered
• Two-sample proportion inference
• Pooled proportion (p̂c)
• Hypothesis setup for two proportions
• Direction of tests (>, <, ≠)
• Conditions for inference
• Step-by-step test setup
• Real-world examples
• Common mistakes and exam traps
AP Statistics Unit 6 Bundle: Confidence Intervals, Hypothesis Testing, Errors & Power. Complete step-by-step notes for exam success.
This Mega Smart Notes Bundle covers the entire Unit 6: Inference for Proportions in AP Statistics, providing a complete, structured, and exam-focused learning system.
Designed to help students move from conceptual understanding → full problem-solving mastery, this bundle includes everything needed to confidently handle both confidence intervals and hypothesis testing.
• 10 high-quality resources
• 60+ pages of structured notes
• Classroom-ready material
• Covers entire Unit 6 syllabus
Topics Covered
• Population proportion vs sample proportion
• Sampling distribution of p̂
• Normality conditions (np ≥ 10 and n(1 − p) ≥ 10)
• Mean and standard deviation (standard error) of p̂
• Effect of sample size and population proportion
• Z-score calculations for proportions
• Probability calculations using normal approximation
• Sampling with vs without replacement (finite population correction)
• Step-by-step problem-solving process
• Common misconceptions and exam tips
Topics Covered
• Definition of point estimators
• Sample mean, proportion, and standard deviation as estimators
• Biased vs unbiased estimators
• Definition and interpretation of bias
• Variability (variance) of sampling distributions
• Effect of sample size on variability
• Independence of bias and variability
• Identifying bias from graphs and distributions
• Comparing estimators
• Common exam question types and strategies
• Common misconceptions and how to avoid them
Topics Covered
• Difference in population means (μ₁ − μ₂)
• Difference in sample means (x̄₁ − x̄₂)
• Sampling distribution of x̄₁ − x̄₂
• Normality conditions (CLT and population assumptions)
• Mean and standard deviation formulas
• Effect of sample size on variability
• Z-score calculations for differences
• Probability calculations using normal distribution
• Interpretation of results
• Common misconceptions and exam traps
Topics Covered
• Difference in population proportions (p₁ − p₂)
• Difference in sample proportions (p̂₁ − p̂₂)
• Sampling distribution of p̂₁ − p̂₂
• Normality conditions for two samples
• Mean and standard deviation formulas
• Effect of sample size on variability
• Z-score calculations for differences
• Probability calculations using normal approximation
• Common misconceptions and pitfalls
• Step-by-step problem-solving framework
Topics Covered
• Sampling distributions of sample means (x̄)
• Central Limit Theorem (CLT)
• Conditions for normal approximation
• Mean and standard deviation (standard error) of x̄
• Effect of sample size on variability
• Z-score calculations for sample means
• Probability calculations using normal distribution
• Interpretation of probabilities
• Unbiased estimator (x̄ as estimator of μ)
• Common mistakes and exam traps
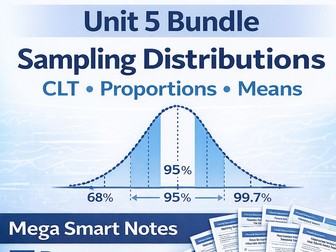
This Mega Smart Notes Bundle includes a complete, structured set of resources covering AP Statistics Unit 5: Sampling Distributions, one of the most important and heavily tested units in the course.
Designed for both teachers and students, this bundle provides clear explanations, step-by-step methods, and exam-focused guidance for mastering all key concepts.
This bundle contains the following topics:
• 5.2 Normal Distribution
• 5.3 Central Limit Theorem (CLT)
• 5.4 Sampling Distributions for Sample Means (x̄)
• 5.5 Sampling Distributions for Sample Proportions (p̂)
• 5.6 Differences in Sample Means (x̄₁ − x̄₂)
• 5.7 Differences in Sample Proportions (p̂₁ − p̂₂)
• 5.8 Point Estimators (Bias & Variability)
AP Statistics – Normal Distribution Mega Smart Notes (Unit 5.2). Clear explanations of z-scores, percentiles, probability calculations, and the Empirical Rule.
These Mega Smart Notes provide a clear and structured explanation of the Normal Distribution, one of the most important topics in AP Statistics.
The material is designed to help students understand both the conceptual ideas and the step-by-step procedures needed to solve problems involving normal models.
Students learn how to interpret normal curves, work with z-scores, connect percentiles with probabilities, and apply these ideas to real statistical situations.
The notes emphasize visual understanding, structured reasoning, and exam-ready methodology, making them ideal for classroom teaching or independent review.
Topics Covered
• Properties of the Normal Distribution
• The Empirical Rule (68-95-99.7 Rule)
• Z-scores and standardization
• Converting between values and z-scores
• Percentiles and their interpretation
• Using z-tables to find probabilities
• Finding probabilities for normal variables
• Working with sampling distributions
• Comparing values across different distributions
• Combining independent normal variables
• Margin of error and critical z-values
Topics Covered
• Sampling distributions (mean and proportion)
• Central Limit Theorem (CLT)
• Conditions for normal approximation
• Mean and standard deviation of sampling distributions
• Standard error formulas
• Effect of sample size on shape and variability
• Comparing simulations and distributions
• Binomial vs sampling distributions
• Using simulations to evaluate claims
• Exam-style problem strategies
• Common mistakes students make