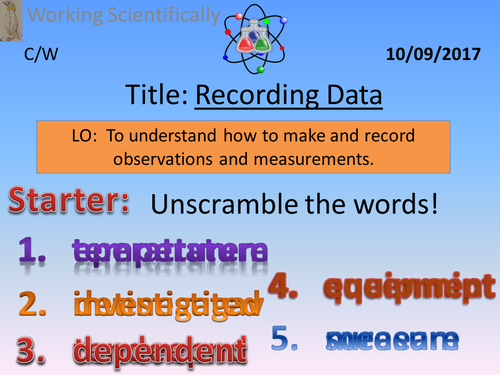
Complete lesson PPT with learning outcomes, new knowledge and activities detailed on the slides. This is the third lesson in the 'Working Scientifically' section. The resource is designed to be used with the Activate practical sheet, Collecting & Presenting Data, and for pupils aiming for developing and secure outcomes. All pupils should be able to state an example of how data can be recorded; most pupils should also be able to add data to a graph or chart; whilst some pupils should, in addition, be able to describe how to make and record observations and measurements. Keywords include outlier, mean, line graph, pie chart, and bar chart. Supporting information and Summary Questions can be found on pages 6 and 7 of the blue Activate 1, KS3 Science Textbook.
Get this resource as part of a bundle and save up to 33%
A bundle is a package of resources grouped together to teach a particular topic, or a series of lessons, in one place.
Something went wrong, please try again later.
This resource hasn't been reviewed yet
To ensure quality for our reviews, only customers who have purchased this resource can review it
Report this resourceto let us know if it violates our terms and conditions.
Our customer service team will review your report and will be in touch.
£3.00
