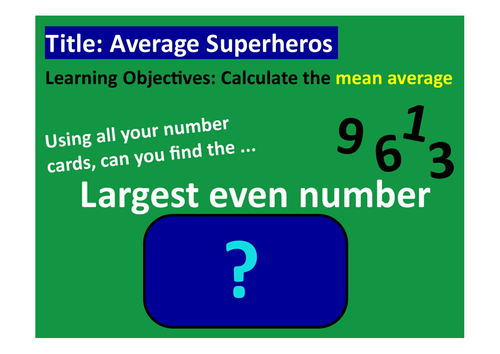


Adapted from 'Top Trump Superheroes - Scattergraphs' - this lesson goes through explaining / demonstrating averages and then into a problem solving exercise, involving selecting a 'crack team&' of superheroes for each mission.
I did this lesson for a peer observation with a bottom set year 8. We found it enormously engaging and fun :)
Something went wrong, please try again later.
This is a nice idea for a lesson on calculating averages. Students are given stats on some superheroes and they have to select the best ones for each 'mission'. For a low ability class this is ideal (as the comment below says there is not a lot of content), for a higher ability class you may need to add in some extension work. Thank you for sharing.
Nicely presented but brief content
Report this resourceto let us know if it violates our terms and conditions.
Our customer service team will review your report and will be in touch.
£0.00