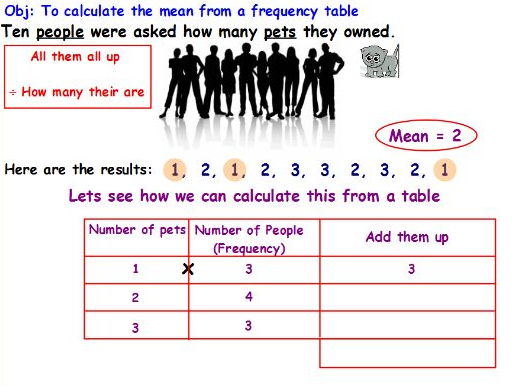


I was fed up of just telling my students to multiply across, add this column, add that column, divide this column by the total of that one and there is the mean... This is what I ended up making:
Starter - Students are asked to calculate the mean from a set of numbers (10 people who were asked how many pets they owned). Easy numbers to divide, straight forward. At this point, I like to demonstrate exactly what mean is
How many pets do these people have?
"Instead of saying this person has 2 pets, this person has 3 pets, this person has 1 pet etc... we just want one number, an average number called the mean which we just worked out"
Main - The starter links straight into the main where the data is sorted into a frequency table and it's demonstrated how we get the same answer working from this table. I really break up the process and go through the whole "add them up" highlighting each of the same numbers and showing that we multiply across, students clearly see where things come from (see my cover image).
On top of this, I have included 5 questions where students sort data into the frequency tables and find the mean (very structured and you can explain why they are multiplying across, adding and dividing). I have a section for just finding the mean from numbers in case some students need to work on finding mean from numbers. I also have a section for calculating mean from a plain frequency tables when your students really get the idea (so there is differentiation). I did this lesson with a weak year 8 class and they got a lot out of it. I highly recommend this, you won't be disappointed. One of my best resources.
Answers are all included. Attached is an activInspire flipchart and worksheets.
Something went wrong, please try again later.
This resource hasn't been reviewed yet
To ensure quality for our reviews, only customers who have purchased this resource can review it
Report this resourceto let us know if it violates our terms and conditions.
Our customer service team will review your report and will be in touch.
£3.00