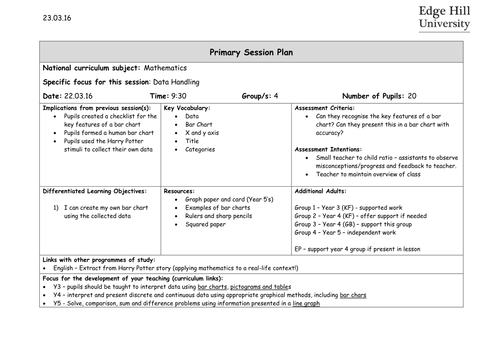


Two Data Handling lessons.
Outdoor, human bar chart activity.
Throughout the lesson, pupils create a checklist for a successful bar chart (x and y axis, bars, categories, numbers/scale etc)
Cross curricular main activity (Harry Potter Theme - English) - pupils are sent a letter from Hermione complaining about her imbalance of Bertie Bott's every flavour beans!
Practical activity whereby children collect their own data to create bar chart. I gave children jelly beans (cheap ones and printed off a posh label!) and required them to count them.
Magic beans used as a reward for hard workers!
Lesson plan, letter from Hermione and Harry Potter story extract, successful bar chart checklist, colour of beans table all included.
Formative assessment (Starter/Plenary) - Children add to what they have learned in different coloured pen on spider diagram.
I used this lesson with years 3, 4 and 5 - can be differentiated for all . They LOVED it.
Lesson 2 - children created 3D Bar Charts.
Something went wrong, please try again later.
Unsure what to do with the smarties and plastic money listed in resources as these are not referred to in lesson plan. Also, could the human bar chart be explained in more detail - what data was represented? In the playground, how did you label each axis?
Report this resourceto let us know if it violates our terms and conditions.
Our customer service team will review your report and will be in touch.
£5.00
