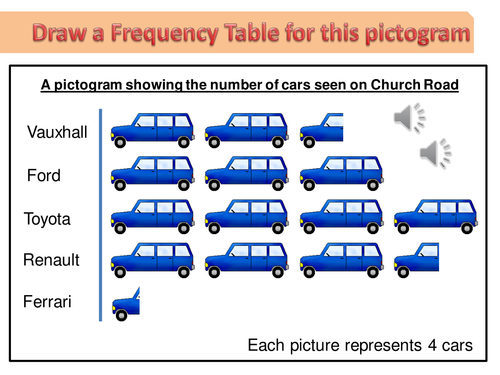

PPT for drawing bar charts, beginning with pictograms and building towards comparative bar charts. Requires students to collect and represent their own data using tally charts, frequency tables and bar charts.
Something went wrong, please try again later.
This resource hasn't been reviewed yet
To ensure quality for our reviews, only customers who have downloaded this resource can review it
Report this resourceto let us know if it violates our terms and conditions.
Our customer service team will review your report and will be in touch.
$0.00