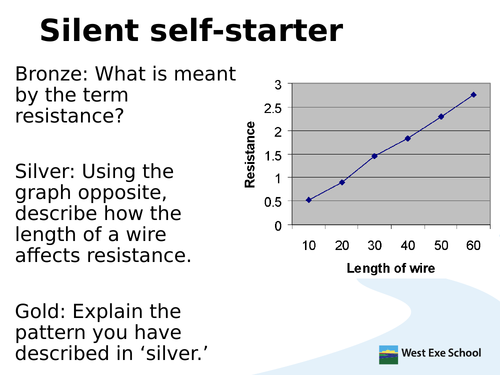


Graph and data interpretation to be used alongside power point. Used for a low ability Y8 Science group. I created differentiated graph templates for the last task- some with axes labelled, some with just the spacing marked to allow all students to reach the same end goal.
Something went wrong, please try again later.
This resource hasn't been reviewed yet
To ensure quality for our reviews, only customers who have purchased this resource can review it
Report this resourceto let us know if it violates our terms and conditions.
Our customer service team will review your report and will be in touch.
£3.00