Owen134866's Shop
Owen134866's Shop
4.785166 reviews

TES Resource contributor of the year 2014 - not really a shop, more a free-for-all take what you want and use it however you like!

ppt, 729.5 KB
ppt, 729.5 KB
doc, 91 KB
doc, 91 KB
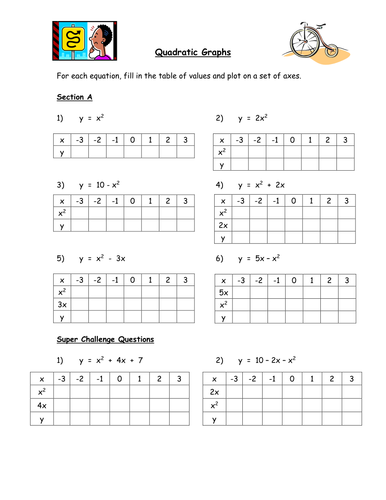
Pupils are shown how to plot Quadratic graphs including both positive and negative x-squared coefficients. Has a few examples of where they may be used to model motion. If you like this resource then please check out my other stuff on here!
Creative Commons "Sharealike"

Reviews

4.8

Something went wrong, please try again later.

speedcuberatabek2002

2 months ago
5

really good explained

danielsdafe

a year ago
5

Thanks for Sharing. Easy to use ppt slides. Even better if the completed table for the worksheet were included

Fatismat

a year ago
5

Very clear explanation

jap901

2 years ago
5

thanks for this - just what i was looking for

anwar_leeds

2 years ago
5

Thanks for sharing. really appreciate it.

Report this resourceto let us know if it violates our terms and conditions.
Our customer service team will review your report and will be in touch.