
NEED a Lesson? Save yourself HOURS and HOURS of planning and preparation time.
This PowerPoint fully supports our popular Research Methods Section of our Popular Student Workbooks and covers the following::
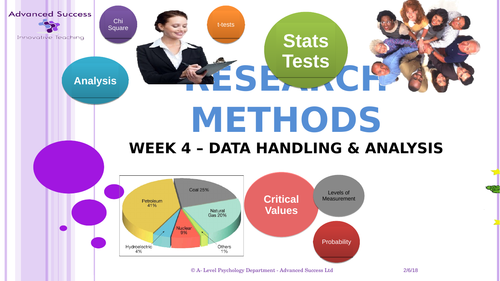
Week 4 Data handling and analysis
Learning Objectives
On completion of this section you should be familiar with the following:
Lesson 1. Types of data
· Quantitative and qualitative data; the distinction between qualitative and quantitative data collection techniques.
· Primary and secondary data, including meta-analysis.
Lesson 2. Descriptive statistics
· Measures of central tendency – mean, median, mode; calculation of mean, median and mode
· Measures of dispersion; range and standard deviation; calculation of range; calculation of percentages.
Lesson 3. Graphs
· Presentation and display of quantitative data: graphs, tables, scattergrams, bar charts.
· Distributions: normal and skewed distributions; characteristics of normal and skewed distributions.
Lesson 4. Data handling and analysis
· Analysis and interpretation of correlation, including correlation coefficients.
Lesson 5. Inferential Testing
· Probability and significance; Type I and Type II errors.
· Factors affecting the choice of statistical test
· The use of statistical tables and critical values in interpretation of significance
FOR FURTHER SUPPORT CHECK OUT - This Lesson on our Twitter Moments https://twitter.com/i/moments/956450738196148224
Get this resource as part of a bundle and save up to 39%
A bundle is a package of resources grouped together to teach a particular topic, or a series of lessons, in one place.
Something went wrong, please try again later.
This resource hasn't been reviewed yet
To ensure quality for our reviews, only customers who have purchased this resource can review it
Report this resourceto let us know if it violates our terms and conditions.
Our customer service team will review your report and will be in touch.
£6.00