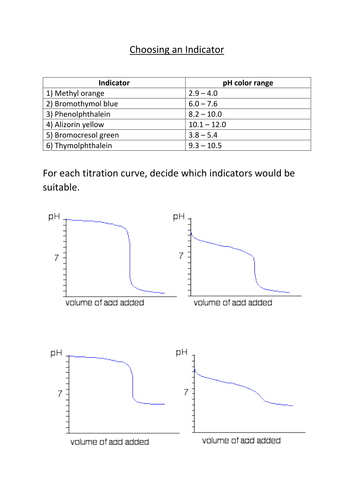

Powerpoint which explains how to plot a titration curve, what it shows and which indicator to use. A worksheet is also included.
Something went wrong, please try again later.
Very, very grateful to you for sharing free. I'm not a KS3 Science teacher, but have been put in that role. You have saved me so much time.
Thank you, just what I was looking for
Thank you.
Thank you - very useful
Clear and informative, one can easily put their own spin on it. Thank you.
Report this resourceto let us know if it violates our terms and conditions.
Our customer service team will review your report and will be in touch.
$0.00
