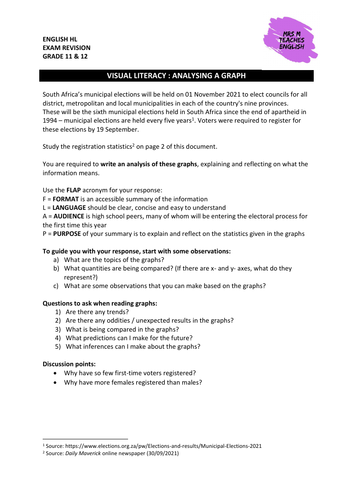
This worksheet gives students an opportunity to examine graphs and reflect on the information contained in the visuals. It was created for South African senior students within the IEB English Home Language curriculum, but could be used as an exercise by anyone interested in the interpretation of data. The graphs show the official voter registration figures for the 2021 local government elections in South Africa.
It can be used as a revision lesson, a sub lesson or as part of an introduction to the analysis of graphs.
Something went wrong, please try again later.
This resource hasn't been reviewed yet
To ensure quality for our reviews, only customers who have downloaded this resource can review it
Report this resourceto let us know if it violates our terms and conditions.
Our customer service team will review your report and will be in touch.
