Frequency diagram and frequency polygon
Lesson presentations and activities
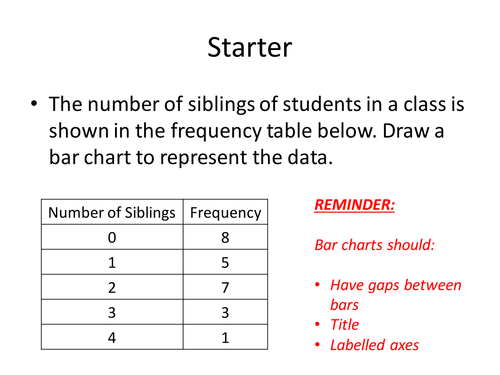
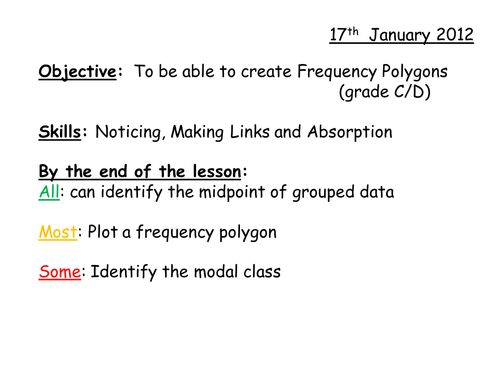
PPT looking at how to draw and compare frequency polygons.
Reviews
HondaCb350K45 years ago
Many thanks for sharing
moominmummy6 years ago
Thank you for sharing.
trudip256 years ago
Looks a great resource to help my Year 11s during the Covid lockdown - many thanks
PowerPoint and worksheet on frequency polygons. Includes a NRICH task.
Reviews
Kiransaif053 years ago
always helful
Denisehawkins15 years ago
superb thank you
Turah5 years ago
Excellent Resource!
Practice questions, homeworks and assessments
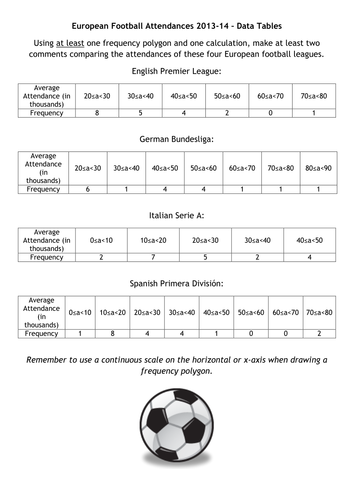
I really wanted some frequency polygon work but it is very thin on the ground, so I came up with this. I have also linked the website from which I got all the data. There are two versions; one (Raw Data) where they must tabulate first, and a second (Data Tables) for those you just want to get on with graphing and interpreting.
Reviews
mimslinn7 years ago
TES Resource Team8 years ago
Thank you for publishing your resource. It has been selected to be featured in a new secondary maths collection.
dsc5059 years ago
An engaging task that gets students to draw frequency polygons for the attendance at various European football leagues. You can choose to give them the raw data to practise creating grouped frequency tables as well, or the author has also provided them already grouped. The task is left deliberately open for students, so they can choose which leagues to use, and what comparisons to make.
Check worksheet to make sure there are no mistakes in the questions. These were made during my PGCE year and I no longer teach so haven't rectified any problems, but I though I&'d share. Made for Year 8 middle set. Comments appreciated.
Reviews
mlad16 years ago
Perfect for my lower ability Year 10 class. Great that you interleaved finding/estimating the mean from a table too!
rafay_fahad7 years ago
TES Resource Team8 years ago
Thank you for publishing your resource. It has been selected to be featured in a new secondary maths collection.
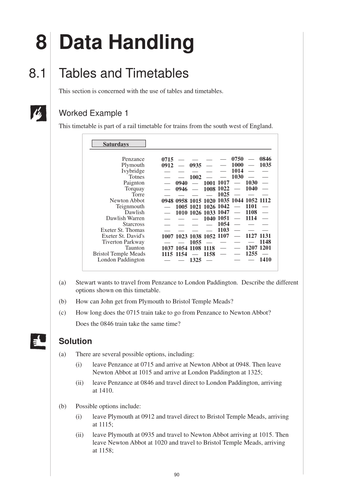
The topic of Data Handling from the GCSE (14 -16 year olds) books of the Mathematics Enhancement Program. For information about these resources and an index for the whole collection please visit https://www.cimt.org.uk/projects/mepres/allgcse/allgcse.htm
Keywords: Questionnaire, Analysis, Question, Biased, Unbiased, Design, Leading, Line Graph, Bar Chart, Process, Display, Conclude, Evidence, Sample, Survey, Multiple Choice, Pilot, Study, Hypothesis, Trend, Bar Chart, Pie Chart, Line Graph, Presentation, Data, Statistics, Scatter Diagram, Graph, Plot, Co-ordinates, Correlation,
Reviews
BPS51116 years ago
Thank you
Mucayit6 years ago
I got great ideas and modify the materials for my students. Ill be teaching the topic two months later so the outcome is still waiting. Thanks for great ideas.
TES Resource Team8 years ago
Thank you for publishing your resource. It has been selected to be featured in a new secondary maths collection.


