Histogram
Lesson presentations and activities
I did this as a total coverage of histograms - hope it's of some use.
Reviews
jalexander10015 years ago
Thank you.
hypot5 years ago
thanks
kiranjha5 years ago
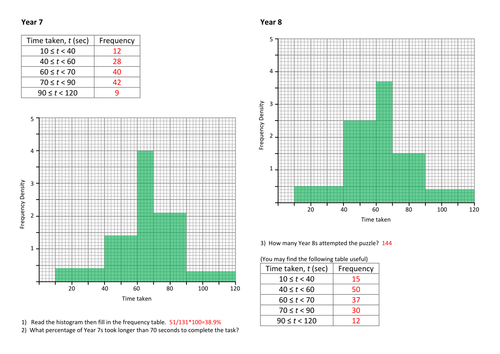
Paired activity. Suitable for KS4. This activity attempts to get students to think about frequency density and how it is used in the construction of a histogram. The is a distinctly 'puzzle' feel to this task, which can take a good half-hour working in pairs.
Reviews
ed11ame4 years ago
Bigbanana5 years ago
Good practical worksheet
MarkGreenaway7 years ago
Practice questions, homeworks and assessments
The resource I always use to introduce histograms.
The context is that I've asked various groups (eg Year 7, Year 8) to do a simple jigsaw puzzle and timed how long they took.
The sheet starts with "read only" questions, then drawing questions then exam style questions. The scales constantly change.Reviews
Dolapo806 years ago
TES Resource Team7 years ago
Thank you for publishing your resource. It has been selected to be featured in a new secondary maths collection.
JennyF1007 years ago
Just what I needed, thank you
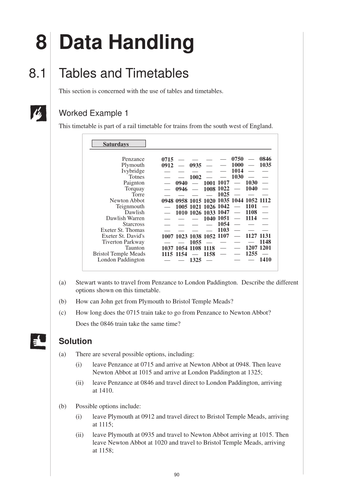
The topic of Data Handling from the GCSE (14 -16 year olds) books of the Mathematics Enhancement Program. For information about these resources and an index for the whole collection please visit https://www.cimt.org.uk/projects/mepres/allgcse/allgcse.htm
Keywords: Questionnaire, Analysis, Question, Biased, Unbiased, Design, Leading, Line Graph, Bar Chart, Process, Display, Conclude, Evidence, Sample, Survey, Multiple Choice, Pilot, Study, Hypothesis, Trend, Bar Chart, Pie Chart, Line Graph, Presentation, Data, Statistics, Scatter Diagram, Graph, Plot, Co-ordinates, Correlation,
Reviews
BPS51115 years ago
Thank you
Mucayit5 years ago
I got great ideas and modify the materials for my students. Ill be teaching the topic two months later so the outcome is still waiting. Thanks for great ideas.
TES Resource Team7 years ago
Thank you for publishing your resource. It has been selected to be featured in a new secondary maths collection.
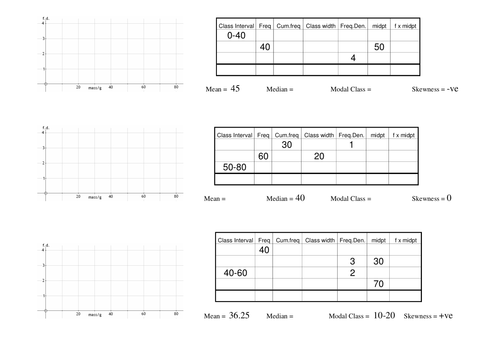
Powerpoints and Worksheets for 2 lessons on Histograms. One where the pupils learn to draw them and one with a recap of drawing as well as how to interpret some simple questions. Some can be done directly from the board with pupils discussing how to answer the questions given. If you like this resource then please check out my other stuff on here!
https://www.tes.com/teaching-resources/search/?f=authorId%5B2095097%5DReviews
jalaram3 months ago
Excellent resources. Thanks for sharing.
mjha1232 years ago
Excellent resources! thank you for sharing.
skaniaru2 years ago
An outstanding resource. Thank you for sharing it.
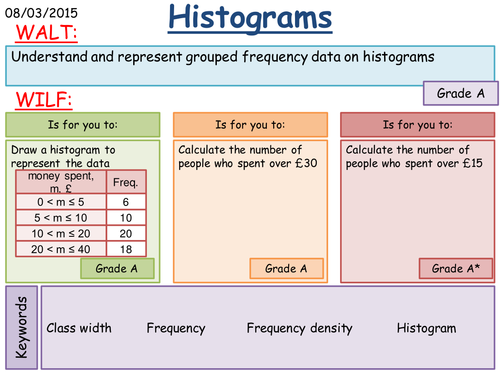
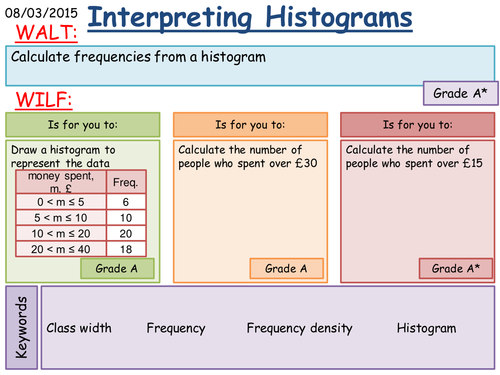
PowerPoint with WALT and WILF, examples, questions to print and answers.
Reviews
UserLondona year ago
Excellent as always from this author
VRusso915 years ago
Thank you
Rosiehns5 years ago
Brilliant! Thank you


