I provide comprehensive worksheets to revise a particular topic (always with answers included) as well as extension materials, for pupils ranging from age about 11 to 16+.
All of my premium resources have a UK and US version.
I provide comprehensive worksheets to revise a particular topic (always with answers included) as well as extension materials, for pupils ranging from age about 11 to 16+.
All of my premium resources have a UK and US version.
Pupils learn about money and get the chance to design their own coins.
Practices simple skills with money and deicmals, and gets them thinking about currencies in general with some extension questions.
This activity is inspired by the Scottish Independence Referendum of 2014.
A series of about 30 Power Points each with mixed starter activities testing basic numeracy of:
- whole numbers
- fractions, decimals, percentages
- money
- graphs
- symmetry
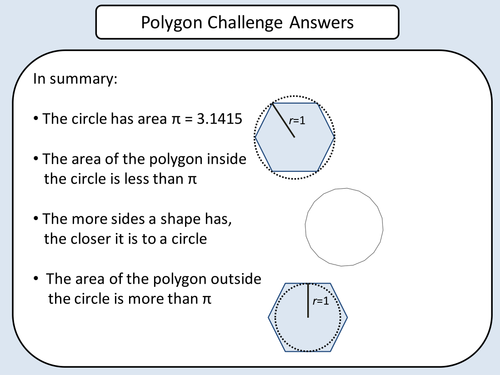
This is an investigation for pupils to discover that the more sides you have on a polygon, the closer the area comes to that of a circle. In fact, using polygons was how people once estimated pi.
Skills used
- trigonometry
- area
- algebra
- Pythagoras
Full solutions included.
A booklet for pupils to fill in with practice questions on curve sketching, of trig graphs and log graphs. Includes translating graphs.
Q1 & Q2 are taken from past papers. Q7 and Q8 are left blank for extra questions.
Full solutions at the end.
Three resources:
A Powerpoint with questions and answers, alongside video solutions.
The following questions are solved:
finding the mean of a sample
finding the variance of a sample
estimating population mean from a sample
estimating population variance from a sample
Mean and Varirance questions by P Benson for which I’ve written out solutions
Expectation Algebra questions
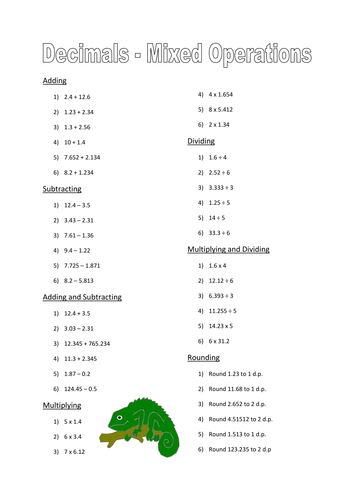
There are two comprehensive worksheets here practicing basic skills with decimals.
Pupils can work individually going through the questions as revision.
Full solutions included.
A Powerpoint presentation I used to introduce a class of smart 16 year olds to some of the simple visual aspects of Topology, with plenty of pictures, strange facts, and links to videos.
Three Powerpoints with simple questions on
percentage change
finding a percentage
-percentage increase or decrease
with extension questions on reverse percentage
Edit: added another powerpoint of mixed questions, a summary sheet, and a worksheet
This is a thought provoking activity about how many variables are needed to describe a shape.
For example, if you don’t care about size, rotation or position all squares are the same.
To define size, one variable is needed.
To define rotation, one variable is needed.
To define position in the 2D plane, two variables are needed.
So to fully define any square requires four variables.
There are many possible different choices for these four.
(Updated 2023)
A fun activity to practice learning about the straight line.
Includes
- drawing graph from data points
- working out the gradient
- working out the y-intercept
- working out the equation of a line from the graph
- using the equation to interpolate missing points
Solutions included
Proofs of some of the key formulas in Advanced Higher Statistics. Not required for the course but some pupils (and teachers) may find it interesting.
proof the two ways of writing the variance formula are equivalent
proof that using the ‘divide by n-1’ formula gives the best estimate of a population variance
proof of Bayes Theorem
proof of laws of expectation and variance
proof of the origin of the Poisson formula, and of the mean and variance
proof of mean and variance for uniform discrete
proof of mean and variance for uniform continuous
proof that using proportions and the normal approximation to a binomial are equivalent
proof a line of best fit goes through the average point
proof the line of best fit gives the least squares
proof of SSR formula
proof in bivariate analysis DF=n-2
proof test slope parameter nonzero and coefficient of correlation nonzero are equivalent
Three examples of how matrices can be used to solve real problems. Requires knowledge of
matrix multiplication
matrix inverses
simple probability
Aimed at Advanced Higher Maths but useful for anyone who wants to answer the question ‘what are matrices used for’.
Questions and solutions on linear regression:
AH Statistics Linear Regression Questions - estimating the value of r, then calculating all of the information by hand from the table of values. Full solutions included.
AH Statistics Regression.pdf - harder questions testing some theoretical topics
AH Statistics Confidence and Prediction Intervals for Regression - questions
AH Statistics Hypothesis Testing in Regression Analysis - longer explanation and questions on the beta and rho tests
AH Statistics Linear Regression Running Times - a Paper 1 style practice question
AH Statistics Regression FlowChart - a suggested order in which to approach bivariate data (data with two variables), starting with approximate methods and checking the validity of the model as you go.
This is a set of six puzzles presented as large scale Power Points. I used them as colour A3 posters for a monthly maths competition.
Although they are challenging, they can all be solved without using any advanced techniques.
Full solutions included.
Edit: Added two more puzzles
Thirteen homeworks each with full solutions, covering the following areas of the course.
1 - Probability
2 - Probability, Sampling, Binomial
3 - Probability, Sampling, Binomial
4 - Binomial, Normal, Poisson #1
5 - Distributions
5a - Distributions and Regressions
6 - Hypothesis Test
7 - Normal Approximation
8 - Control charts, Confidence Interval, Fences
9 - Mean and Variance
10 - Binomial, Normal, Poisson #2
11 - Z and T tests
12 - More Distributions
13 - Wilcoxon and Mann Whitney
For some of the homeworks (2,3,5) I have made slightly different alternative versions and they are included too.
Update: homeworks 2,5,7 updated March 2023
A set of multi-part questions covering both chi-squared test for association and goodness of fit
A set of questions building up to using chi-squared to work out whether a Binomial or Poisson distribution fits the data
Both provided with full solutions.
15 numeracy questions of increasing difficulty.
Multiple copies should be printed out (one-sided) and each team starts on Q1. When they bring you the answer to that they get Q2, and so on.
Topics covered:
percentages
simple algebra
angles in a triangle/quadrilateral
time
Included with answers.
A rare chance to see the first ever use of an equals sign "for what could be more equal than two parallel lines" and therefore the first ever equation.
Pupils can read the Olde English, translate it into modern equations, then solve them. The first two are linear, the remaining four quadratic.
Provided with full solutions.
A problem solving project where pupils use Pythagoras to find how far away the horizon is, depending on your height about sea level.
This is an open-ended project, where rather than being given all the information up front the pupils have to work in groups to explore the problem, then reflect on what techniques were effective.
It practices several useful skills such as Pythagoras, circle geometry, expanding brackets and rearranging formulas.
There is the scope for very good pupils to extend the project in interesting directions.