
83Uploads
9k+Views
5k+Downloads
Economics

Demand (SMART NOTEBOOK VERSION)
Please note that this is a SMART NOTEBOOK presentation and not a PowerPoint presentation

Rational Decision Making (Economics)
17 slides in total, including a fun starter activity
This presentation took me 30 minutes to go through with my class

Poverty, Lorenz Curve, Gini Coefficient
This presentation contains:
Colourful, detailed and engaging slides throughout
A ‘random name selector’ key term starter activity
7 timed past MCQs on a range of Economic concepts (interactive timer included) All answers included.
Activities throughout
Detailed notes throughout
Explanations of Lorenz Curve and Gini-coeffient
A comprehensive presentation.
There are 65 slides in total and this lesson took me an hour and a half to go through with students

Consumer and Producer Surplus
Included in this PowerPoint:
Colourful and engaging slides
Guess the question starter activity with answers (questions and answers cna be changed)
Detailed notes
A range of activities throughout with answers
Step by step demonstrations on how to show and calculate both the consumer and producer surplus
This presentation contains 38 slidea and took me an hour to go through with students
Protectionism (Economics)
A detailed (102 slide) PowerPoint presentation on tariffs, quotas, trade subsidies and other forms of protectionsim.
This presentation includes:
Colourful slides
Videos
Activities
Links to syllabus
A detailed step-by-step instructions on how to draw tariff, quota and trade subsidy diagrams
Homework activities
Contextualised examples

Terms of Trade
This colourful and informative resource is fully comprehensive, and includes a number of tasks that test learning that do not require any marking from the teacher.
Included:
A detailed and colourful title screen, outlining the learning objectives and including an interactive timer and picture animations
A ‘guess the question’ starter activity with answers that tests understanding of earlier macroeconomic content
A quiz on UK imports and exports
Detailed explanation of ‘weighted indexes’ with questions and answer scheme included
Past exam question with mark scheme on terms of trade
Link to a video reviewing terms of trade and index numbers
Detailed explanations of factors affecting terms of trade and Prebisch-Singer hypothesis
8 mark question with mark scheme
Homework tasks, including a link to a Teams Quiz with 17 questions on terms of trade. Questions are self-marked when students respond
All resources took me 3 lessons to go through

Free, Mixed and Command Economies
The PowerPoint attached is an informative presentation that explains the difference between command, mixed and free market economies.
Contextualised exams provided throughout.
This presentation contains 18 slides and took me 30 minutes to go through
Rational Decision Making
This resource is a 17 slide PowerPoint that explains the concept or rational decision making.
Included in the presentation:
A colourful and informative title slide that outlines the learning objectives
An engaging and interactive online ‘vortex’ starter activity. Students need to match which key term links with which of four topics. Activity is self marked and instructions are included
Explanations of how rational decision making is a principle of neo-classical economics
Contextualised examples of how customers don’t always act rationally (Nudge Theory, Third Decoy, Dopamine, FOMO)
Explanation as to why consumers may not act rationally
This resource took me 30 minutes to complete

Market Structures and Competition
This lesson can be used either to teach Business students about competition, market structures and how consumers can be affected by anti-competitive practices OR to teach Economics students about the different features of market structures and why competition / a lack of competition affects different stakeholders.
Included in this lesson:
A colourful and detailed title slide outlining the key learning objectives
An income elasticity of demand starter activity suitable for both Business and Economics students (calculation / explain / diagram question). A printable slide of the questions has been provided with a detailed answer key on next slide for peer marking.
A detailed and contextualised example of how a lack of competition affects different stakeholders (Epic Games legal battle with Apple over Fortnite)
Brainstorming activity on competition
A rank in order activity on types of competitive markets
Detailed notes on competition, monopolies, oligopolies, monopolistic competition, perfect competition, Game Theory, types of anti-competitive practices such as Cartels, OFT.
This presentation contains 37 slides and took me an hour to go through with my students.

Market Failure (Types of)
This lesson introduces the concept of market failure and explains what each of the key types of market failure are (externalities, under-provision of public goods and information assymmetry)
Included in this presentation is:
A colourful title slide with the key learning objectives
A ‘guess the question’ starter activity with answers
A step-by-step explanation as to what market failure is
Video showing an extreme example of externalities
Fill the blanks externality activity
Externalities sorting activity with answers
Positive externality activity
Information gap activity
Detailed and colourful notes throughout
This presentation is 32 slides in length and took me one hour to go through

Indirect Taxation WORKSHEET
A worksheet that tests understanding of directly and indirect taxation.
There are 4 activities in this worksheet:
A fill the blanks activity that tests students understanding of types of direct and indirect taxation and the correct terminology used depending on the tax being discussed
An activity where students need to calculate tax per unit, incidence on producers, consumers and government revenue
An activity where students need to explain why the incidence on the producer / consumer changes depending on the price elasticity of demand
An extension of activity 2 where students are given 4 additional diagrams where they need to complete additional calculations and label the incidence / tax revenue
3 multiple-choice questions on indirect taxation
Detailed answers of all* activities are provided in this worksheet
This activity took between 20 and 30 minutes for my students to complete
Inflation
Included in this PowerPoint:
A detailed and colourful title slide that outlines the key learning outcomes and equipment required for the lesson
A starter activity where students are required to guess how the price of 5 goods and services has changed over time (closest for each round wins). Students really enjoy this activity
Explanation of why / when inflation becomes a problem, how it affects incomes and sectors where incomes have risen lower and higher than inflation
Explanation in basket of goods / weighted index
Step by step explanation of how inflation is calculated using weighted index
Activity (with answers) where students are required to calculate inflation changes using a weighted index
Activity (with answers) - identify which goods and services have been recently added and removed from the basket of goods
Explanation of difference between demand-pull and cost-push inflation with examples
Diagrams for both types of inflation
Presentation is detailed and colourful throughout
There are 52 slides in total and this presentation took me an hour and a half to go through.

Cross Elasticity of Demand
This PowerPoint includes:
An activity that introduces students to the concept of complements, substitutes and unrelated goods
A activity where students have to match pairs of complement and substitutes goods
An activity where students have to calculate the XED of a pair of goods
Detailed notes on how to calculate XED and what the data means
This presentation contains 21 slides and took me 45minutes to complete

Globalisation / Introduction to International Marketing
Using MCDONALD’S TSUKIMI BURGER, Tesco’s failure to succeed in the US, Apple’s failure to succeed in India, and many others, this PowerPoint seeks to explore the reasons why businesses wish to sell in international markets, the challenges and constraints.
Included in this PowerPoint:
A detailed title page, outlining the key skills covered in this topic
A recap on moving averages with answers. This topic is included in some syllabi earlier in the marketing unit but can be deleted if not required
A starter activity introducing the concept of globalisation where students need to match McDonalds products based on the country whey are sold
(demonstrating how products need to be adapted based on the market they are targeting). Answers are provided
An explanation of reasons why businesses choose to sell products in overseas markets
A contextualised example for each reason
Detailed explanations as to each of the reasons why how marketing activities need to change depending on which country goods are being sold
Video 1: Reasons why Tesco failed in US (poor marketing)
Video 2: Reasons why Apple failed in India (poor marketing)
Introduction to some of the factors that make trade between countries easier
This lesson took me an hour and a half to go through.

Indirect Taxation - Economics
This presentation contains 73 slides and introduces what tax is before going into detail about indirect taxation and how to interpret diagrams that ask questions on indirect taxation.
Included in this presentation:
A Catchphrase starter activity
A true of false short quiz that asks students about 4 different types of tax around the world
Information about how much tax is generated in UK compare to poorer countries, what that tax revenue is spent on and how it is sourced
Distinctions between direct and indirect taxes. Although Econs exams focus more on indirect taxes, explaining direct taxes gets students engaged into the lesson
A ‘how much tax does BOJO pay’ activity that students really enjoy
Notes on indirect taxation
A step by step explanation of how to interpret and make calculations on tax diagrams
A calculation activity that students need to complete
Notes on disadvantages of tax increases
Evaluative suggestion points the extent to which tax rises are harmful
These slides took me an hour and a half to go through with my students.

Demand and the Demand Curve
A PowerPoint presentation on demand includes:
Catchphrase starter activity
Demand activity (graph paper required)
Detailed explanations of demand, reasons for shape of demand curve, movements, shifts, ceteris paribus
This lesson took me 60 minutes to go through
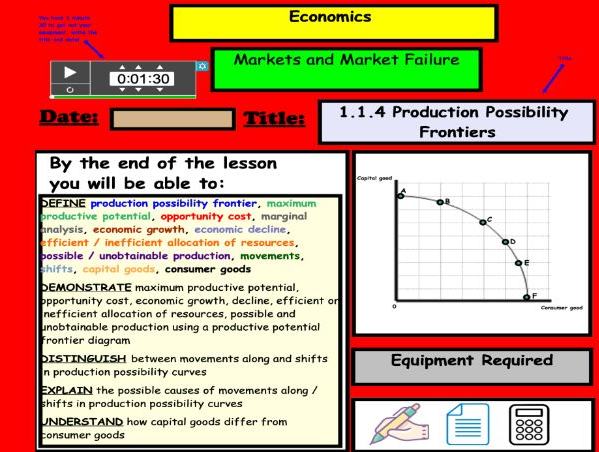
Production Possibility Frontier
A colourful, informative and engaging PowerPoint lesson on the production possibility frontier / curve (PPF/PPC).
Included in this lesson are:
A colourful and detailed title slide providing detailed learning objectives
A discussion starter activity that introduces the concept of choice
A mix and match activity where students need to identify and explain the difference between economic and free goods
Detailed notes
Consumer goods activity
Step by step break down of what the PPF is, opportunity cost, how it is calculated, marginal analysis, movements, shifts
There is also a free blank template of a PPF on my store that you can print and get students to fill in as it is explained

Types of Taxation (Direct and Indirect)
A colourful and detailed presentation that explores types of taxation. Included in this presentation:
A fun Catchphrase starter activity where students have to look at images to guess the name of a product or service (my students love this!)
An initial true or false quiz about types of taxes (England specific)
4 slides illustrating how much tax revenue the UK generates in comparison to other countries and how that tax revenue is spent. A sample payslip is also shown to illustrate some of the deducations are taken from income tax
Colourful and detailed examples of the main forms of tax students need to know about (income, corporation, VAT, National insurance, business rates)
A ‘how much income tax does Boris pay!’ activity that students love. It illustrates that income tax brackets are different at different thresholds of income
Disadvantages of taxation
Useful tips and notes as to how to evaluate a question that refers to taxation
This lesson took me an hour to complete

Price Elasticity of Demand WORKSHEET
A detailed and colourful worksheet designed to test a range of skills covered in this topic. The worksheet contains 6 activities, each taking between 5 and 15 minutes to complete. It took most of my students between 45 minutes and an hour to finish this worksheet. The activities are as follows:
Activity 1 - A fill the blanks activity that test students’ knowledge of the vocal and terminology used
Activity 2 - Calculating PED, percentage changes and recognising the different types of PED
Activity 3 - ‘Developing your answers’ - students need to recognise and explain factors that influence PED
Activity 4 - Revenue boxes
Activity 5 - Diagrams
Activity 6 - More complex calculations / application
ALL ANSWERS ARE PROVIDED IN DETAIL and have been written in a way that is broken down for students to easily understand. I ran this activity as a peer marking exercise and collected everyone’s work at the end of the lesson to check if there were any gaps in understand to review the following lesson. This saved a lot of time!