A Simple lesson which recaps what factors help to define a place, helps students to revise their place studies in a way that is focussed on the AQA specification, looks at an example 4 mark question and marks it and provides a 20 mark question for students who need 20 mark question practice.
This lesson was created for a KS3 year 8 class, although I would suggest that it would work for year 9 too.
The lesson involves using prior knowledge about latitude and longitude (although this can be gone over quickly if needed) to plot the towns along the Camino de Santiago.
Pupils will create a route across northern Spain and then use altitude data to plot this on a line graph. There are a range of questions based on this map & graph which ask students to analyse the data provided and improve their geographical/mathematical skills. The plenary involves asking pupils to work out where each photo was taken, using their map and graph to help.
A lesson aimed at key stage 3 geographers, discussing where we get from from in the UK. Also looking at which countries import and export more produce and why.
The lesson involves a think pair share, a task for students to work out the meaning of key terms in context and paragraph practise using a handout. There is also a plenary which involves peer assessment.
This is a skills lesson based on the country of Nigeria. It fits into the topics of ‘The Changing Economic World’ and ‘Geographical Skills’ for AQA GCSE.
Students will calculate Birth Rate and GDP per capita for different states of Nigeria. This should help them to understand these development indicators more clearly and be able to distinguish between Birth Rate and Fertility Rate.
They will then create a choropleth map to show the variation in Birth Rate in different states of Nigeria.
They will also complete 2 scatter graphs (axes are provided) to show the relationship between Birth Rate and GDP per capita and Birth Rate and Fertility Rate.
There are then some exam style questions to help them understand the data and analyse it. Suggested answers are also provided.
All worksheets are ‘hidden slides’ on the Powerpoint so that it can be saved as one file.
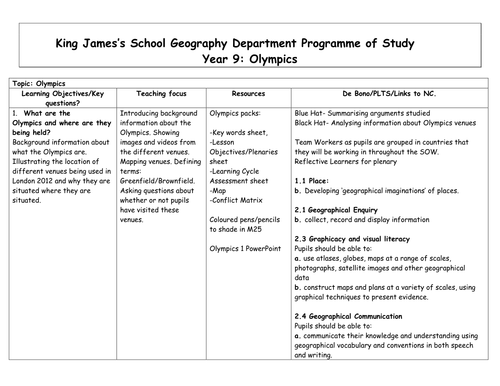
Includes Powerpoints, lesson plans and resources to teach a SOW on the Olympics. Assessment material included.
Keywords: Brownfield, Greenfield, Transport, Developers, Urban
Suitable for AQA KS4 Spec A.
Links in with Water Availability in UK and in Ghana. Simulation game where pupils have to work out how much money to spend on what and how to adapt to climate change and water shortages.
Links with numeracy and encourages decision making skills
Group work lesson.
Lesson 3 in the Resource Management Scheme of Work. Pupils will be creating a map to show water stress across the UK and then completing a comprehension activity based on an article from the RGS about Water Stress and Water Policy in the UK
Lesson 2 in the Resource Management Scheme of Work. Discusses the causes and impacts of the UK’s reliance on importing food. Pupils will create a pie chart about the breakdown of the cost of purchasing mangetout. They will then use 2 handouts to define, or contrast ‘Agribusiness’ and ‘Organic Farms’.
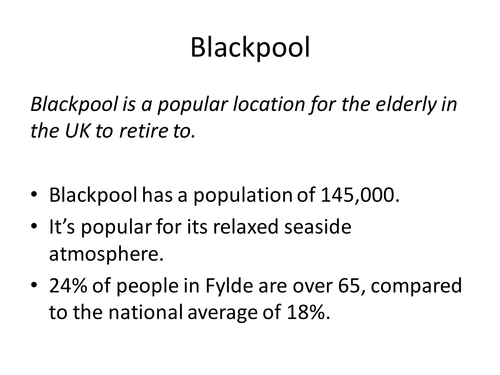
Lesson 1 of he Manchester set of lessons for the Urban Case Study. Other lessons available to purchase if you like this introduction lesson. For AQA grades 9-1 Geography GCSE. Includes a booklet for students to work through. Includes sharing own knowledge of Manchester, looks at different viewpoints of Manchester through marking on a map of the city, includes a video and structured note taking on the history of Manchester, and completing a compound bar chart based on census data.
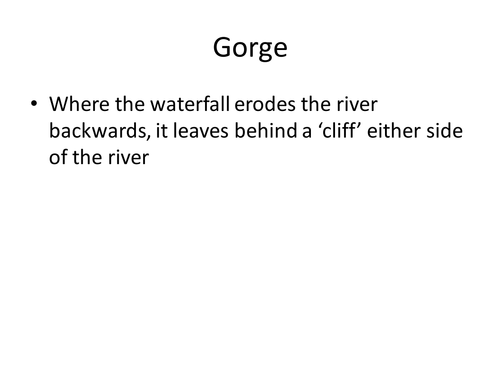
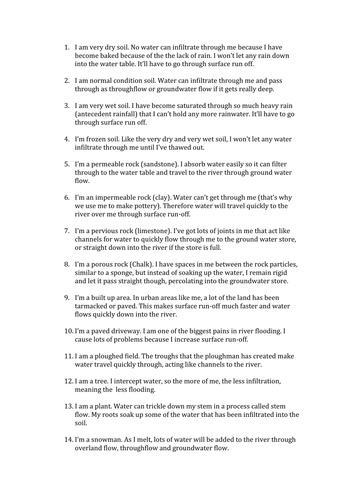
AQA A GCSE: Water on the Land
'I'm a...'
Numerous card that are left under pupils' desks. Each pupil reads off his/ her card to explain how different processes affect river discharge.
Key terms: interception, percolation, infiltration, permeable, surface run-off, through flow, groundwater flow etc.
AQA AS Level- Geography of Heatlh
Includes definitions of key terms/statistics e.g. morbidity, mortality, maternal mortality, life expectancy etc.
Great to stick around the classroom and use as an information collection exercise so pupils get out of their seats for a break.
An introduction to epidemiology. Asks students to research and place certain events on a timeline to show how the disease has spread. Then complete a line graph to show the number of cases in these countries. Students will then describe their graphs, create a prediction as to what will happen next and think about how social distancing and population structure will affect their predictions.
There is a KS3 and KS5 version of this lesson also available and I hope to write a follow up lesson over the Easter Holidays.
Photo starter. students must come up with questions about the photos Leads on nicely to Development Compass Rose. Getting students to come up with their own questions.Triangle assessment One question. Two new things. Three key words/phrases
An introduction to epidemiology. Asks students to research and place certain events on a timeline to show how the disease has spread. Then complete a line graph to show the number of cases in these countries. Students will then comment on their graphs, create a prediction as to what will happen next and think about how social distancing and population structure will affect their predictions.
There is a KS3 and KS4 version of this lesson also available and I hope to write a follow up lesson over the Easter Holidays.
Continues from the first lesson a couple of weeks ago. Asks students to look back at their predictions to see how the virus has increased, calculate the cases per million of the population and then the fatality rate. Students will then think about why the fatality rate varies in different countries and come up with a prediction of how the number of deaths will change over the next few weeks.
There is a KS4 and KS5 version of this lesson also available and I hope to write a third lesson about coronavirus hotspots in the UK over the next couple of weeks.