Hero image

ReallyUsefulMaths

Average Rating4.11
(based on 168 reviews)

The Resources within this shop are all designed for the teaching of Mathematics for those in the age range 7 - 18 years old. Most resources consist of a PowerPoint lesson followed by a worksheet for the students. With over twenty nine years of experience, the powerpoint/worksheets within the shop have been used successfully by myself and colleagues over that time. As a head of department for over 15 years, the department has yearly been judged as adding substantial value to students grades.

369Uploads

198k+Views

132k+Downloads

The Resources within this shop are all designed for the teaching of Mathematics for those in the age range 7 - 18 years old. Most resources consist of a PowerPoint lesson followed by a worksheet for the students. With over twenty nine years of experience, the powerpoint/worksheets within the shop have been used successfully by myself and colleagues over that time. As a head of department for over 15 years, the department has yearly been judged as adding substantial value to students grades.
Stationary Points
sjcoopersjcooper

Stationary Points

(0)
This lesson is an introductory lesson into finding stationary points for a quadratic or cubic. This lesson looks at finding the nature of the stationary points by change of gradient. The lesson concludes with a couple of slides with questions for the students to answer.
Tangents and Normal to a curve
sjcoopersjcooper

Tangents and Normal to a curve

(0)
This lesson teaches students what is meant by a tangent and normal to a curve. The lesson then works through some examples finding the equation of a given tangent or a given normal.
Inverse Functions
sjcoopersjcooper

Inverse Functions

(0)
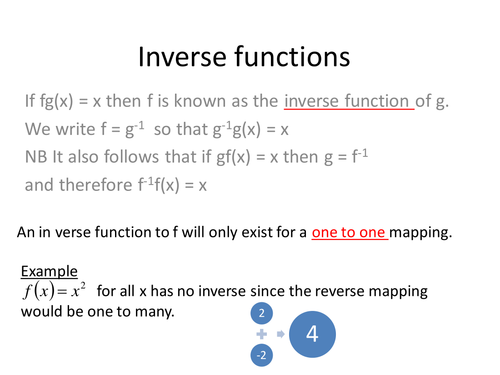
This lesson shows students how a function f(x) can be rearranged to obtain the inverse function. Students are also shown the graph of an inverse function when given the graph of y = f(x).
Calculating the mean
sjcoopersjcooper

Calculating the mean

(0)
This Powerpoint consists of a variety of worked examples which demonstrate how we can calculate the mean. I use this lesson with students who have probably met the topic before but require a revisit to the topic. I usually use this lesson before I introduce student to the "fx" column and therefore questions involving the frequency table.
Introduction to Index Notation
sjcoopersjcooper

Introduction to Index Notation

(0)
This lesson introduces students to the first two rules applied when multiplying or dividing numbers to given powers. The powerpoint consists of worked examples and concludes with a worksheet for the students to complete.
R Alpha Method
sjcoopersjcooper

R Alpha Method

(0)
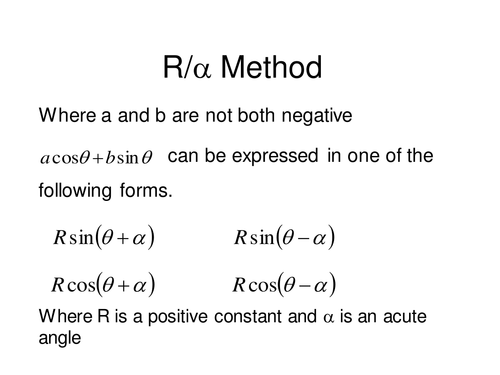
This lesson introduces students to the R Alpha method. It is expected that the compound angles have been taught first. This lesson calls upon that knowledge and shows how this method is useful in a variety of situations.
Surface Area
sjcoopersjcooper

Surface Area

(0)
This lesson looks at finding the surface area of shapes such as cuboids, square based pyramids, cylinders, cones and spheres. The lesson also shows a proof for the surface area formula of a cone. However for this students to understand this proof it is essential that they have already met arc length and area of a sector. The lesson contains a number of worked examples.
New Grade 6 Material: Test 1
sjcoopersjcooper

New Grade 6 Material: Test 1

(0)
This is a Test I will use to check whether my students have met the standards required for topics which have been labelled as grade 6 in the new GCSE. Clearly I have listed which topics are tested and students are given this list in advance so that they can revise the highlighted topics. More tests will follow as I prepare them and then bundles will become available.
Introduction to Algebra
sjcoopersjcooper

Introduction to Algebra

(0)
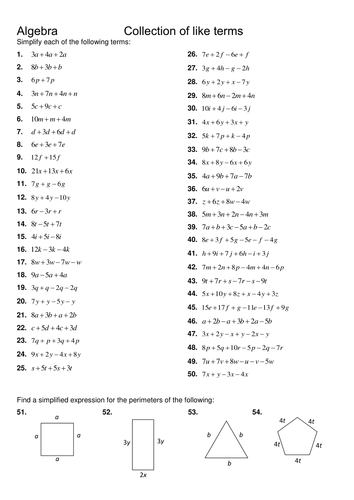
Introduction lesson to Algebra which involves the ability to collect like terms. The lesson consists of a number of worked examples. This is followed by a worksheet for students to complete either in class or as a piece of homework. Answers are provided.
Introduction to drawing Pie Charts
sjcoopersjcooper

Introduction to drawing Pie Charts

(0)
Ideal for students meeting pie charts for the first time. This power point lesson teaches students how they must alter the frequencies in order to draw a variety of pie charts. The additional PowerPoint has the protractor shown on more questions for those students who need that amount of detail at the board This lesson is accompanied with a worksheet for students to answer in class or as a piece of homework. An Additional worksheet have been added for those who require it.
Finding the Percentage of a quantity
sjcoopersjcooper

Finding the Percentage of a quantity

(0)
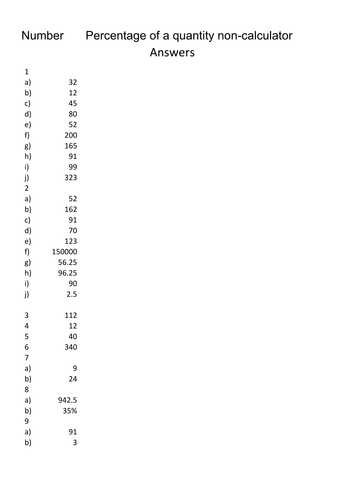
Lesson of worked examples involving how to find the percentage of a quantity without the use of a calculator. The lesson also includes a worksheet for students to work through. Answers are included.
Dividing into a given Ratio
sjcoopersjcooper

Dividing into a given Ratio

(0)
The series of worksheets and worksheet generator looks at a variety of ratio questions students could meet in the new GCSE examination. The first worksheets look at the more basic dividing into a given ratio. subsequent worksheets look at the more complicated ratio questions that appear on the papers and many students struggle to answer. The reason behind the generated question excel package is that you can generate an infinite number of worksheets. Hence students can have endless practice at this questions. Alternatively you can generate a complete set of different questions so that each member of the class has their own set to answer!
Area of a circle
sjcoopersjcooper

Area of a circle

(0)
A lesson introduces the students to pi. Students work out for themselves with little guidance that pi is approximately 3 or even 3.1. This also gives the teacher the opportunity to introduce the formula for the area of the circle. The follow up lesson also on this resource has several examples involving finding the areas of circles. The resource also contains a worksheet for students to answer either in class or as a piece of homework.
Probability Sample Space
sjcoopersjcooper

Probability Sample Space

(0)
A power point presentation covering examples of two event represented in a sample space diagram. Including how to use the diagrams to find the probabilities of two events occurring.
Decimal Places
sjcoopersjcooper

Decimal Places

(0)
This Lesson in a PowerPoint which introduces students to the topic of decimal places through a series of worked examples.
Addition of Fractions
sjcoopersjcooper

Addition of Fractions

(0)
This lesson is a Powerpoint and Worksheet which I have used to teach students how to add fractions together. This lesson is taught once I have covered equivalent fraction. Once the worked examples have been covered students should be given the worksheet to either complete in class or as homework. A Brexit question involving a village turn out for the referendum is a recent addition. Answers to the worksheet are also provided.
Equivalent Fractions
sjcoopersjcooper

Equivalent Fractions

(0)
This lesson is intended for younger students, when first meeting the notion of equivalent fractions. The powerpoint consists of examples where shapes have the same amount shaded areas but divided into different amounts. Hence students can see equivalent fractions as being "the same" or better still equal through area shaded. The lesson also contains a worksheet with answers to backup the lesson.
Bar Charts
sjcoopersjcooper

Bar Charts

(0)
This lesson I usually teach to the younger students. I prefer to drawn horizontal bar charts as the labelling is much easier to represent. However there are examples of vertical bar charts in the powerpoint and worksheet. One of the slides is designed to carry out a tally chart in class. Once the tally has been collected you can place the information into the next slide and a horizontal bar chart for the live data will be presented.