The Resources within this shop are all designed for the teaching of Mathematics for those in the age range 7 - 18 years old. Most resources consist of a PowerPoint lesson followed by a worksheet for the students.
With over twenty nine years of experience, the powerpoint/worksheets within the shop have been used successfully by myself and colleagues over that time. As a head of department for over 15 years, the department has yearly been judged as adding substantial value to students grades.
These two lessons and worksheets are lessons which cover the translations of graphs and the knowledge of stretching a graph by a given scale factor.
The lesson is aimed at the students working out the translation which takes place by initially drawing certain graphs and then linking them the original graph drawn. This is then followed by a series of examples.
The second lesson is similar in that the students are encouraged to draw a series of graphs before linking them to the original as a stretch. The lesson then continues with a series of worked examples.
Both lessons have a worksheet with solutions.
This lesson has been used over the years as an introduction to factorising initially the basic trinomials before looking at the more complicated trinomials.
The lesson also consists of a worksheet with solutions for students to attempt in class or as a piece of homework.
This activities are aimed at key stage 3 students but could be used as revision for students who are revising for their GCSE examination.
Each round consists of four questions. Print the slides 8 to 13 on A4 paper and place one printed slide per table.
Students are put into pairs (either by choice or teacher selection) and are given a copy of slide 14 and a few sheets of pieces of A4 paper.
The pairs are designated a starting table and the timer (slide 2) is started. The students are then given 5 minutes to answer the four questions on that table. Once the five minutes is up the students move clockwise to the next table and start the next set of four questions and the timer of slide 3 is started. This continues until all students have completed the six tables worth of questions.
The answering of the questions takes no more than 30 minutes. Students then remain at their final table, swap their answer sheet with the nearest table and the answers are produced. At this stage I go through the questions before revealing the answers. In this way the students have had a go at GCSE style foundation questions and have also seen a demonstration as to how they should have been answered.
Finally, students add up their score and the highest score get a prize!
This bundle of work consists of three lessons with worksheets.
Lesson one : Collection of like terms.
This lesson and two worksheets covers the ability to collect like terms when simplifying a series of terms.
Lesson two : Simplifying expressions
This lesson and two worksheets looks at multiplying terms together where algebra is involved. (At the same time revising the knowledge of - x - or - x +, etc)
Lesson three : Substitution into formulae
This lesson and two worksheets covers the ability to substitute numerical values into simple algebraic expressions
Two worksheets have been given per lesson so that if the class has an issue with the first worksheet, then a review of the work can take place with the follow up worksheet used to demonstrate improvement.
These lessons are suitable as an introduction to Algebra or for the younger students who have little knowledge in Algebra.
The package here contains both worked examples and printable worksheets. The lessons start with very simple equations and shows how they can be solved. The lessons increase with difficulty to a reasonable standard for students aged 9, 10 or 11. Or for students who struggle with this topic at the higher ages.
A lesson introduces the students to pi. Students work out for themselves with little guidance that pi is approximately 3 or even 3.1.
This also gives the teacher the opportunity to introduce the formula for the area of the circle.
The follow up lesson also on this resource has several examples involving finding the areas of circles.
The resource also contains a worksheet for students to answer either in class or as a piece of homework.
Lesson introduces students to the Cosine Rule formula which can be used for a variety of triangles.
The lesson then has a series of worked examples before ending with a a number of questions for students to complete.
These two PowerPoint presentations teach students how we find the area of a triangle and a trapezium. Now that students must learn the formula for the area of a trapezium I have shown how the formula is created through the knowledge of the area of a triangle.
Through worked examples students learn how to apply these formulae.
This lesson is a Powerpoint and Worksheet which I have used to teach students how to subtract fractions. This lesson is taught once I have covered addition of fraction.
Once the worked examples have been covered students are given the worksheet to either complete in class or as homework. Answers to the worksheet are also provided.
This lesson is a Powerpoint and Worksheet which I have used to teach students how to divide fractions. This lesson is taught once I have covered multiplication of fraction.
Once the worked examples have been covered students are given the worksheet to either complete in class or as homework. Answers to the worksheet are also provided.
This lesson teachers students about the iterative formula. The ability to identify why there is a root between two points. The ability to generate an iterative formula. The presentation also demonstrates that not all iterative formulae work.
The lesson follows with a worksheet for the students to attempt either in class or as a piece of homework. Answers are included.
This lesson makes use of the Venn diagram and introduces students to the probability of A union B and A intersection B. The students then make use of these formulae in other examples.
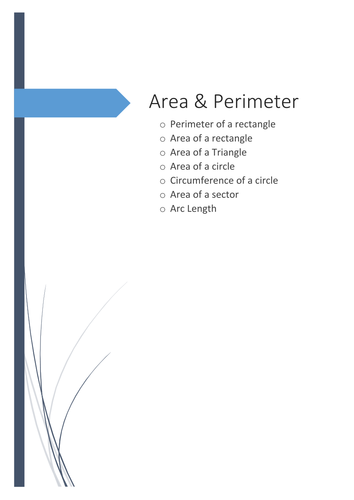
This work book consists of worksheets which are used with the lessons on
Area of a rectangle
Perimeter of a rectangle
Area of a triangle
Area of a circle
Circumference
Area of a Sector
Arc Length