I am a full time secondary teacher and head of department who started teaching in 2004. I love to teach mathematics and try to create interesting and dynamic visual resources to enhance the delivery of my subject. I hope you find my resources useful.
I am a full time secondary teacher and head of department who started teaching in 2004. I love to teach mathematics and try to create interesting and dynamic visual resources to enhance the delivery of my subject. I hope you find my resources useful.
A differentiated interactive geogebra applet that aids the modelling (with solutions) of solving quadratic equations by factorising. Also links the graphical understanding of the solutions. Please see the video for how the use the teaching aid. I have also included two differentiated worksheets with solutions (one for higher tier GCSE and one for higher tier GCSE). These are also previewed in the video.
The geogebra applet is attached but if you don’t have it installed then the web link is also attached so you can use the applet in any web browser.
A differentiated interactive geogebra applet that aids the modelling (with solutions) of calculating angles…
==> in full turns
==> on a straight line
==> in a triangle (including isosceles traingles)
==> Between parallel lines (alternate)
==> Between parallel lines (corresponding)
==> Between parallel lines (supplementary)
… and also forming equation using the above facts. Please see the video for how the use the teaching aid. I have also included three differentiated worksheets with solutions. These are also previewed in the video.
The geogebra applet is attached but if you don’t have it installed then the web link is also attached so you can use the applet in any web browser.
A dynamic and interactive probability tree structure generator. Generate questions and create the corresponding tree so students can practice interpreting questions. This is a geogebra applet so you need the application installed or use the web link so you can use within a web browser without the need of installing geogebra
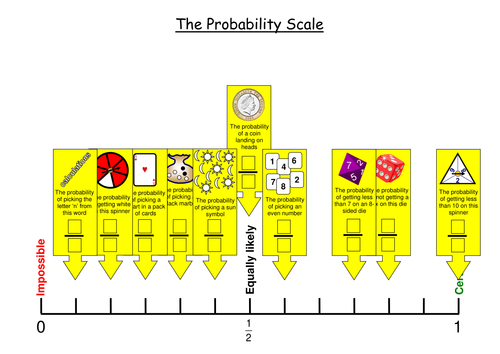
Scroll through the examples and press 'start' to start the event scrolling up and down the probability scale. Invite students to the board to click the screen to stop the even in the correct position. Revel the fraction using the buttons and split the probability scale into fractions using the 'fraction' button to see if the even it accurately placed. Includes student activity worksheet.
An interactive and dynamic PowerPoint that models how to add and subtract fractions using pictures. Use the 'fraction' buttons to show the visual representation of each fraction and click on each sector to shade it in. Click on 'add/subtract' once to reveal the common denominator shape and again to visually see the fractions adding together.
An interactive PowerPoint to model solving quadratic and cubic equations using trial and improvement. Use the +/- buttons on each row to change the input and click on the x number shown to watch it dynamically substitute. Click on the blank parts of the table to reveal the substituted parts evaluated. Using the +/- button on the next row, modify the input and substitute again by clicking on the number shown and repeat the process. If more table is needed, click clear.
An interactive PowerPoint that models how the rate of change changes over time in the context of filling containers with water. Select the container set and fill them up using the control buttons to show their corresponding graphs.
An interactive PowerPoint that models the three views of a 3D object. Use the navigation buttons to scroll through the examples and use the plan, side and front buttons to show the object rotate into the correct position. Before revealing, invite students to the board and ask them what the views might look like by clicking on the square grid. I have attached some questions also.
An interactive PowerPoint and worksheets that model how to complete/create patterns with rotation symmetry using tracing paper. Using the navigation buttons...1)Select the example, 2)Show the tracing paper, 3)Trace the design, 4)Rotate the tracing paper to find the missing parts of the design.
An differentiated interactive geogebra applet that aids the modelling (with solutions) of reading, writing, drawing and calculating with bearings. Please see the video for how the use the teaching aid. I have also included three differentiated worksheets with solutions. These are previewed in the second video.
The geogebra applet is attached but if you don’t have it installed then the web link is also attached so you can use the applet in any web browser.
An interactive geogebra applet that aids the modeling (with full worked solutions) of using length area and volume scale factors to find missing values. Please see the video for how the use the teaching aid. I have also included two differentiated worksheets (one for lengths and areas and one for length, area and volumes) and a scafolding sheet to support students. These are also previewed in the video.
The geogebra applet is attached but if you don’t have it installed then the web link is also attached so you can use the applet in any web browser.
I've always struggles to show students how subtraction works as a balance as it can't be visulaised, until now!Keep the balance of the scales by adding or subtracting content from both sides. Do this by clicking on the 1's or x's at the top to add on and on each side of the balance to remove them. Pop the balloons by adding weights to both sides (sound effects included!)
Starts by finding LCMs and HCFs by listing and extends to using prime factors and Venn diagrams to calculate LCMs and HCFs. Scroll through the PowerPoint using the navigation buttons. Reveal the covered factor trees by clicking on the covers and click the end branches of each tree to select the prime factors. Once all end (prime) numbers have been found use the show/hide button to reveal the Venn diagram. Click on the prime factors again to place them into the Venn diagram. Click on the LCM or HCF to reveal the answers.
A big PowerPoint that is fully interactive and models both doing and describing all transformations. I have also added in a lesson plan for instruction how to use. Fully interactive with dynamic examples.
An interactive PowerPoint that uses prime factor trees and Venn diagrams to model how to calculate the LCM and HCF. Uncover the end branches by clicking on the covers, click on the end branches to select the prime factors, show the Venn diagram and click on the selected factors to place them in the Venn diagram.
Scroll through the first few slides to introduce a cuboid (hover over the pictures to reveal the properties and click on the boy pushing over the rectangle to revel transform a rectangle into a cuboid). Break down the layers of the cuboid examples by clicking on the x, y, z buttons to see the layers separate and questions students on the associated multiplications and the commutative properties of multiplication. When the cubes can't be seen, hover over the faces of the cuboid examples to reveal the cubes and click the covers to reveal the answers.