


Recent
Most read
Most shared

The second year of data for the key stage 2 multiplication tables check (MTC) has been published today, revealing several trends that will be of interest to teachers and school leaders.
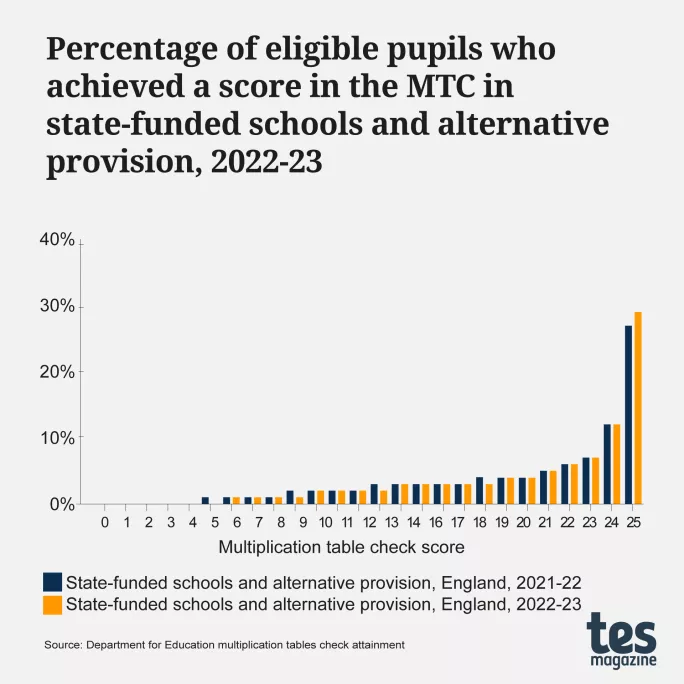
The top-line findings are that 29 per cent of pupils achieved full marks of 25 out of 25, up from 27 per cent in 2022, and the average attainment score rose to 20.2, up from 19.8 in 2022.
Beyond these figures, though, are some notable variations in attainment by pupil characteristics and region.
1. The disadvantage gap
As in 2022, the multiplication check results show a clear disadvantage gap.
Specifically, pupils known to be disadvantaged scored an average of 18.3, compared with pupils not known to be disadvantaged scoring an average of 20.9 - a gap of 2.6 marks.
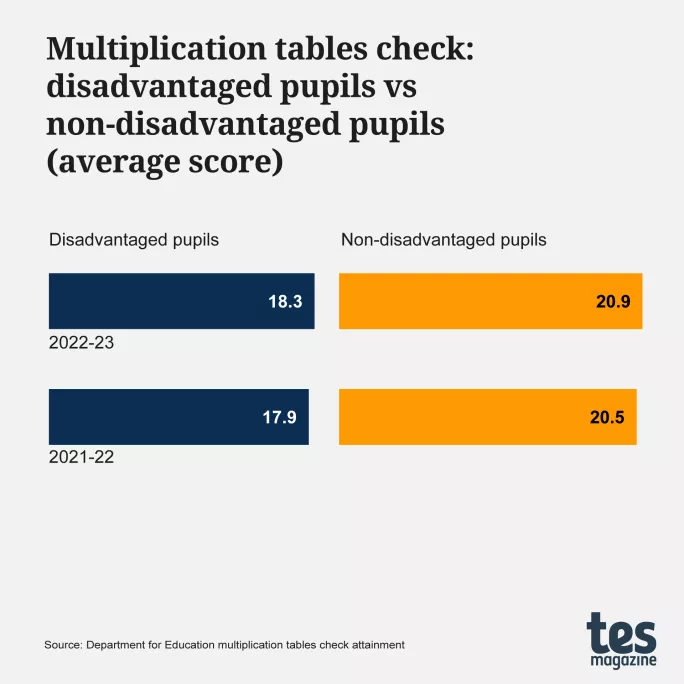
This was the same gap as in 2022, although the fact that this gap remained steady shows that the overall uplift in results was enjoyed by all students.
However, when we look at the number of pupils achieving full marks in the test (the most common score), we see a more significant gap between disadvantaged pupils and their peers.
There was a gap of 12 percentage points this year, with only 21 per cent of disadvantaged pupils achieving a score of 25, whereas 33 per cent of non-disadvantaged pupils hit full marks.
This gap remained the same as last year, when 18 per cent of disadvantaged pupils achieved a score of 25, compared with 30 per cent of their non-disadvantaged counterparts.
If we look at the other end of the scale, we also see a pattern in the number of students scoring 0 or 1. Of the 4,233 pupils who scored just 1 or 0, 60.9 per cent were disadvantaged.
2. Gender
As in 2022, boys outperformed girls in the MTC in 2023, with the average score of boys being 20.4, an increase of 0.4 from the year before.
Girls also saw an increase in their average score, rising 0.3 from 19.6 to 19.9.
Boys were more likely to achieve full marks on the test in comparison to their female counterparts, with 38 per cent of all boys achieving a score of 25, compared with 28 per cent of girls.
It is also worth noting that 5 per cent of boys did not take the test, compared with 3 per cent of girls.
3. Pupils with SEND
Pupils with special educational needs and disabilities (SEND), including those with an education, health and care plan (EHCP), also saw uplifts in their MTC scores.
Specifically, EHCP pupils’ average score increased from 14.5 to 14.7, while pupils receiving SEND support went from 15.5 in 2022 to 16.0 in 2023.
However, large numbers of pupils with SEND did not take the test, similar to 2022: 53 per cent of EHCP pupils did not take the test and 6 per cent of students with SEND support did not take the test.
Given the lack of adaptations for the test, the fact that so many pupils are unable to take it may raise questions for policymakers.
4. Regional variations
As last year, London scored the highest regional mark for the MTC. Its mean average score of 21.1 was almost a full point higher than the national average of 20.2.
This score was boosted by the borough of Redbridge, which was the only area nationwide to pass the 22 average score threshold, at 22.1.
The West Midlands beat the national average with a score of 20.3, while the North East matched it at 20.2. Meanwhile, the South West was at the lowest end of the scale again with a score of 19.7, the only region below 20 for its average.
5. Attainment by month of birth
Just as in 2022, there is a clear correlation between a pupil’s month of birth and their score in the MTC, with September-born pupils scoring the best and scores then gradually sliding down towards the lowest scores in August.
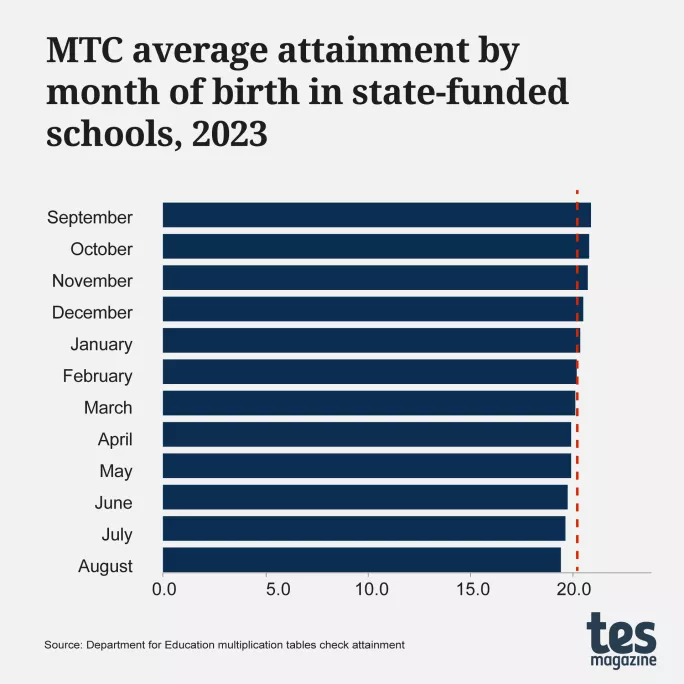
All pupils across the different months improved on the year before, though, aligning with the general improvement seen across the MTC scores.
6. EAL
Pupils for whom English is an additional language once again scored more highly than pupils for whom English is their first language.
In 2023, children whose first language is believed to be English achieved an average score of 19.9, compared with 21.4 for pupils whose first language is not English.
This trend is similar to in last year’s results: in 2022, children whose first language is believed to be English achieved an average score of 19.4, compared with 21.2 for pupils whose first language is not English.