Break-Even Analysis and Chart
This resource is mainly to help students understand Break-Even Analysis as well as create a Break-Even Chart in Business Studies.<br />
<br />
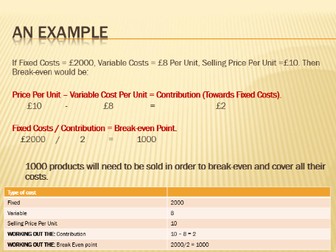
There is a match up of key terms and definitions as a starter, followed by the presentation that includes a link to a video which students can make notes about. Students are shown how they can use a table method to assist them in working out the break-even point for a business as well as tasks to enable them to practice their newly found skills.<br />
<br />
Finally there is a plenary task where students will need to rearrange the formula on paper to show the correct formula for working out the break even point.<br />
<br />
The PPT then moves on to lesson 2 - the break even graph. The presentation explains how to plot a graph as well as what it will look like - with fixed, variable, total costs outlined as well as sales revenue.<br />
<br />
This is a good introduction to Break-Even Analysis.
