63Uploads
70k+Views
13k+Downloads
Mathematics

Problem Solving (scaffolded) with solutions!
10 GCSE Maths questions taken from past papers and made into an A5 (8 page) booklet. They have prompts for weaker students and show the breakdown of the marks, as in what information is needed to get the mark.
Full worked solutions are included too.

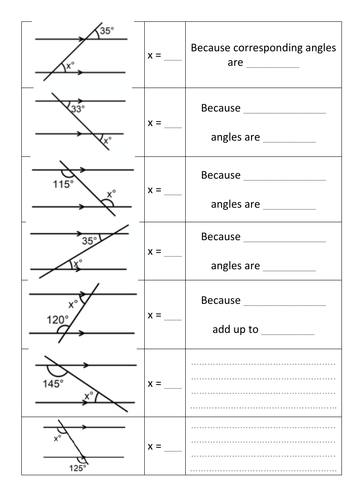
Angles in parallel lines (low ability)
Write on worksheet for low ability students . Structure of sentences to support.

Standard Deviation Worksheet
8 questions on standard deviation. The first two questions include the table for ease. The last question is a comparison between standard deviation and the mean.

Ratio 1:n and n:1
16 questions on writing a ratio as 1:n and n:1. Example question, three levels of difficulty and an extension involving fractions on both sides. Answers provided.

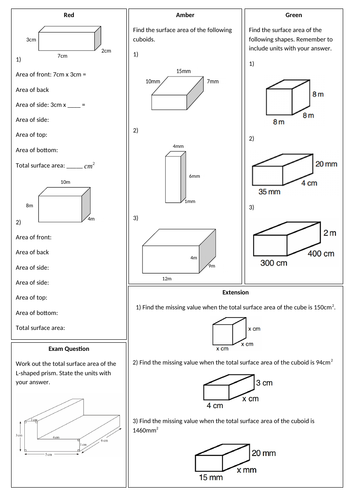
Surface area of cubes and cuboids
An A4 sheet with Red, Amber, Green, Extension and Exam question practise. Tests skills from the beginning to change to units, and working backwards.

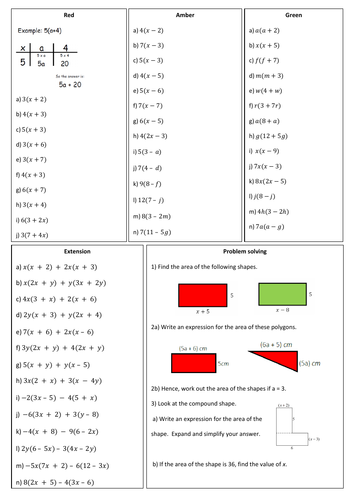
Expanding a single bracket
This worksheet is broken down into four levels of difficulty:
Red,
Amber
Green
Extension
It also includes a problem solving section.
Answers are also provided.

Transformations of functions
GCSE A*, Core 1
A card sort for the transformation of functions, including vector form.
A matching activity for transformation and their vectors.

Adding, subtracting, multiplying and dividing surds
Surds, Grade A, Adding, Subtracting, Multiplying, Dividing, Irrational, four operations

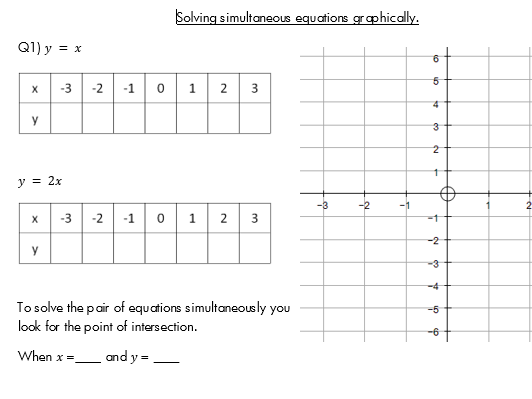
Solving simultaneous equations graphically
A flip chart showing an introduction and an example (along with extension questions). The worksheet has four practise questions for students to use.

Time series, moving averages and mean seasonal variation
GCSE Statistics:
Three worksheets on:
1) Comparing time series graphs and then plotting.
2) Calculating moving averages and plotting.
3) Calculating the mean seasonal variation.
Peer assessment task on comparing time series graphs (GCSE exam question)

Back to back stem and leaf diagram
Starter - Comparing pie charts.
Activity - Interactive collection of data involving pulse rates.
Worksheet - Drawing back to back stem and leaf diagrams and finding the range and median.
Extension - comparison using the range and median.
Please rate and leave feedback.

Drawing and comparing frequency polygons
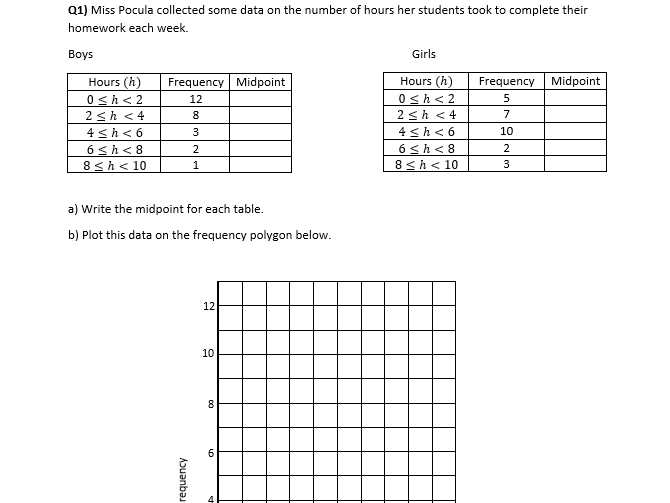
Four page worksheet, where students draw two frequency polygons on one and compare the similarities and difference. Q1 and Q2 have the graph drawn for support. Q3 - Q6 the graph needs to be drawn.

Writing a ratio as a fraction
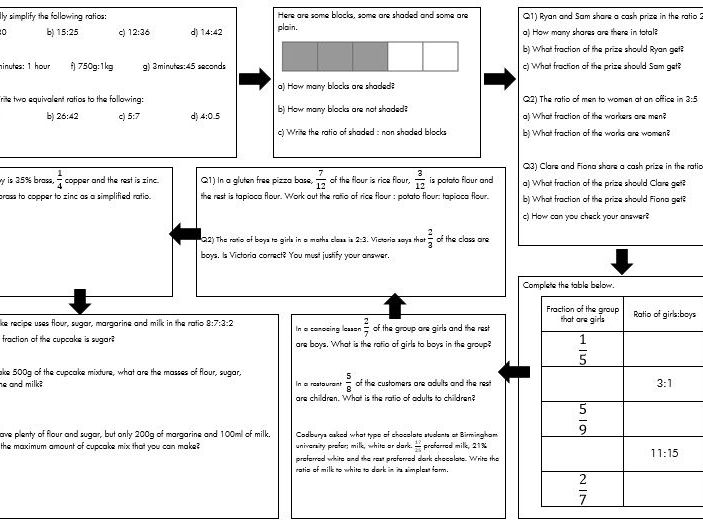
This topic has been focused on recently in the new GCSE. This worksheet starts with simplifying ratio, onto a visual comparison, then onto writing a ratio as a fraction. Their skills are then tested by converting between fractions and ratios. Questions get challenging and students need to use skills from other areas of mathematics.
Please leave feedback so that this resource can be improved.

Finding the area of a rectangle
A differentiated A3 sheet on finding the area of a rectangle.
The resource includes a literacy section, warm up, bronze, silver, gold and platinum levels of difficulty.
Students will feel both supported and suitably challenged with this resource.

Quadratic Graphs
6 equations for quadratic graphs. Each question involves the following:
generating coordinates
plotting the graph
finding the coordinates of the turning point,
finding the coordinates of the y intercept
finding the equation of the line of symmetry
finding the solution to f(x) = 0
It is scaffolded at the beginning, the final graph is a negative quadratic.

Drawing Pie Charts
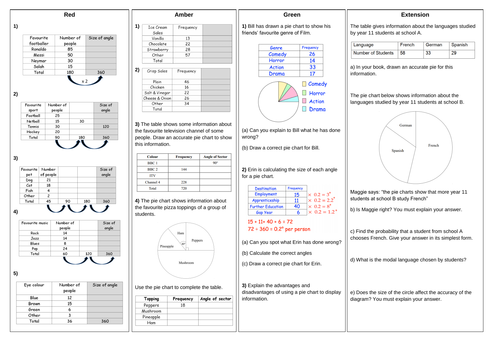
A differentiated (RAGE) worksheet on drawing pie charts. Questions range from a simple multiply the frequency by two, to interpreting the angle and an excellent comprehension question from a GCSE exam paper.

Factorising a single bracket
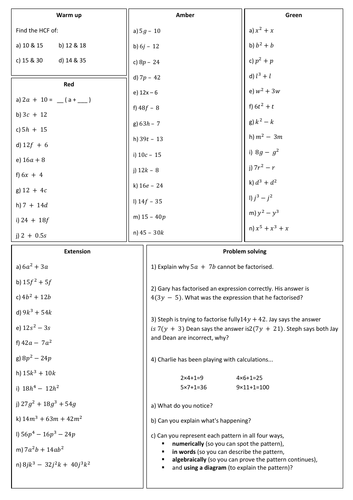
Red, Amber, Green, Extension and problem solving sections for factorising a single bracket.
Answers provided.

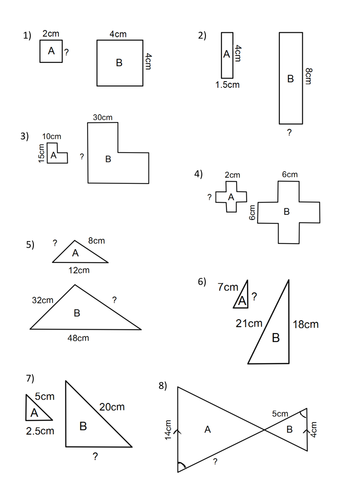
Understanding scale factor
8 questions where pupils can find the scale factor from A to B and then use this to find the missing lengths.

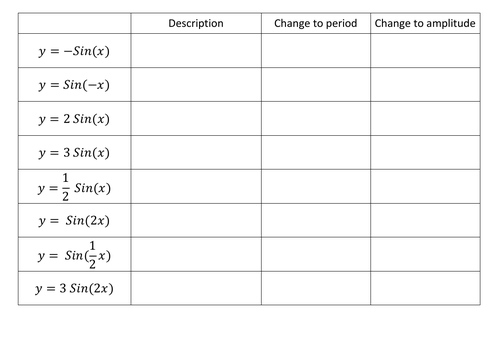
Transforming Trig Graphs - Sine and Cosine
A lesson on plotting Sine and Cosine, and transforming the curve. Worksheets and answers provided, alongside a Desmos interactive demonstration.

Remote Learning Scavenger Hunt - Maths
To allow students to see Maths outside of the “classroom” and have some time away from the screen, I’ve created a photo scavenger hunt. Students are to upload their pictures into the downloaded word documents.


