I recently downloaded the RSC’s very useful “education in chemistry” resource on titrations. The documents are beautifully produced, but I was appalled that the “diagram” column in the equipment tables were low resolution bitmapped graphics. I thought I would produce my own simple diagrams in vector form, so that they can be used at any scale without pixellation. I provide this as a pdf which you can copy and paste from freely, but if you need SVG files , please feel free to contact me via my web site.
They may be of use to someone, somewhere.
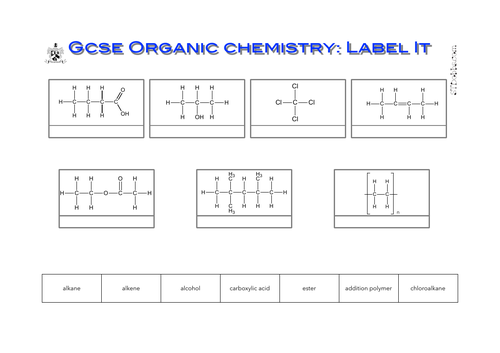
there are many diagrams of the fractionating column out there. I unashamedly drew on many of them as inspiration for this. However, they are almost exclusively low resolution, bitmapped graphics. I have made my version as an infinitely scalable vector graphic. I then used it to make this labelling exercise. Just for the love of it really. I hope someone might find it useful.
I used AQA’s list of measurement terms (which is included) to make a wordsearch, bingo game, and match the definition sheet.
NB: I have now added the definitions as a presentation, in both powerpoint and keynote formats. I made it in keynote and exported to powerpoint, so the keynote version is better.