Using R to draw the equation of a straight line graph - Part 2Quick View
rgirlsschoolrgirlsschool

Using R to draw the equation of a straight line graph - Part 2

(0)
This lesson follows on from ‘Using R to draw the equation of a straight line graph - Part 1’ and demonstrates how to use R to plot straight line graphs (y=mx+c) with different intercepts and negative gradients followed by questions on the observed differences. There are then plenty of activities to practice using the code. The maths is KS3 level. This lesson assumes some knowledge of working in an R Markdown file which can be gained by working through the ‘My First Introductory R Lesson using R Markdown’ and ‘My Second Introductory R Lesson using R Markdown’ both available on TES. No previous knowledge of R coding language is needed. The contents of the word file needs to be copied into an R Markdown file before use. This lesson assumes that you have installed RStudio or have access to RStudioCloud. If you have any queries or feedback please get back to us rgirlsschool@gmail.com
Using R to draw a graph of results from Rates of Reaction Chemistry GCSE practicalQuick View
rgirlsschoolrgirlsschool

Using R to draw a graph of results from Rates of Reaction Chemistry GCSE practical

(0)
The lesson starts with a worked example to introduce the R code needed to draw a graph of the mean time for the cross to disappear against the concentratrion of sodium thiosulphate and then allows the student to reproduce the graph using their own data. Students should bring to the lesson their results from their practical experiments investigating the rate of reaction using colour change or tubidity (required practical for AQA GCSE Chemistry https://filestore.aqa.org.uk/resources/chemistry/AQA-8462-PRACTICALS-HB.PDF page 46) The lesson ends with some questions about their results. It is recommended that ‘My First R Lesson using R Markdown’ and ‘My Second R Lesson using R Markdown’ have been completed prior to this lesson if students have no previous experience with R Markdown. The content of the word file needs to be copied into an R Markdown file before use. This lesson assumes that you have installed RStudio or have access to RStudioCloud. If you have any queries or feedback please get back to us rgirlsschool@gmail.com
Using R to draw the equation of a straight line graph - Part 1Quick View
rgirlsschoolrgirlsschool

Using R to draw the equation of a straight line graph - Part 1

(0)
This lesson is part 1 of 2 and demonstrates how to use R to plot straight line graphs (y=mx+c) and to observe what happens when the value of m changes There are then plenty of activities to practice using the code. The maths is KS3 level. This lesson assumes some knowledge of working in an R Markdown file which can be gained by working through the ‘My First Introductory R Lesson using R Markdown’ and ‘My Second Introductory R Lesson using R Markdown’ both available on TES. No previous knowledge of R coding language is needed. The contents of the word file needs to be copied into an R Markdown file before use. This lesson assumes that you have installed RStudio or have access to RStudioCloud. If you have any queries or feedback please get back to us rgirlsschool@gmail.com
My Second R Lesson using R MarkdownQuick View
rgirlsschoolrgirlsschool

My Second R Lesson using R Markdown

(0)
This lesson follows on from ‘My First R Lesson using R Markdown’ where students were introduced to the layout of an R Markdown document. In this lesson we start to look at the R code itself and to identify the commands needed to draw a bar chart. The lesson starts with instructions on how to enter the data into a tibble and progresses through drawing the bar chart, labelling it and colouring the bars. The word file needs to be copied into a R Markdown file before use. This lesson assumes that you have installed R Studio or have access to R Studio Cloud. If you have any queries or feedback please get back to us rgirlsschool@gmail.com
Using R code to draw box plotsQuick View
rgirlsschoolrgirlsschool

Using R code to draw box plots

(0)
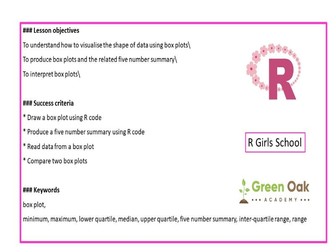
This lesson starts with an example showing how to use R code to draw a box plot and calculate the 5 number summary followed by an activity where the student produces their own. The second example demonstrates how to use R code to draw two box plots side-by-side to compare data, followed by an activity where the student plots their own. Questions are set to interpret the comparisons. It is suggested that ‘My First Introductory R Lesson using R Markdown’ and ‘My Second Introductory R Lesson using R Markdown’ both available on TES has been completed previously to gain experience of working in an R Markdown file. The contents of the word file needs to be copied into an R Markdown file before use. This lesson assumes that you have installed RStudio or have access to RStudioCloud. If you have any queries or feedback please get back to us rgirlsschool@gmail.com
Using R to generate sequences - Part 2Quick View
rgirlsschoolrgirlsschool

Using R to generate sequences - Part 2

(0)
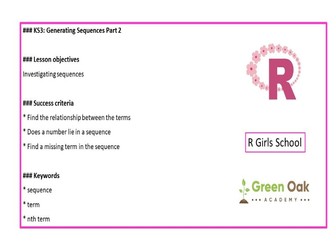
This lesson follows on from ‘Using R to generate sequences - Part 1’ and demonstrates how to use R to find the relationship between terms, investigate whether a number lies in a sequence and find a missing term. There are plenty of activities to practise using the R code. The maths is KS3 level. This lesson assumes some knowledge of working in an R Markdown file which can be gained by working through the ‘My First Introductory R Lesson using R Markdown’ and ‘My Second Introductory R Lesson using R Markdown’ both available on TES. No previous knowledge of R coding language is needed. The contents of the word file needs to be copied into an R Markdown file before use. This lesson assumes that you have installed RStudio or have access to RStudioCloud. If you have any queries or feedback please get back to us rgirlsschool@gmail.com
Using R code to investigate Pythagoras' TheoremQuick View
rgirlsschoolrgirlsschool

Using R code to investigate Pythagoras' Theorem

(0)
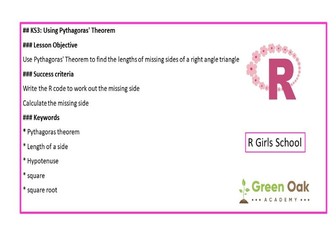
This lesson starts with an example showing how to use R code to draw triangles and to calculate the length of the missing side. There are then plenty of activities to practice using the R code. The maths is KS3 level. This lesson assumes some knowledge of working in an R Markdown file which can be gained by working through the ‘My First Introductory R Lesson using R Markdown’ and ‘My Second Introductory R Lesson using R Markdown’ both available on TES. No previous knowledge of R coding language is needed. The contents of the word file needs to be copied into an R Markdown file before use. This lesson assumes that you have installed RStudio or have access to RStudioCloud. If you have any queries or feedback please get back to us rgirlsschool@gmail.com
Using R to generate sequences - Part 1Quick View
rgirlsschoolrgirlsschool

Using R to generate sequences - Part 1

(0)
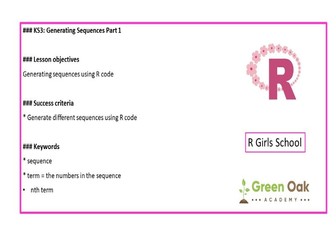
This lesson demonstrates how to generate sequences using R code and then provides activities for further practise. This lesson is the first of two and leads on to ‘Using R to Generate Sequences - Part 2’. The maths is KS3 level. This lesson assumes some knowledge of working in an R Markdown file which can be gained by working through the ‘My First Introductory R Lesson using R Markdown’ and ‘My Second Introductory R Lesson using R Markdown’ both available on TES. No previous knowledge of R coding language is needed. The contents of the word file needs to be copied into an R Markdown file before use. This lesson assumes that you have installed RStudio or have access to RStudioCloud. If you have any queries or feedback please get back to us rgirlsschool@gmail.com
My First R Lesson using R MarkdownQuick View
rgirlsschoolrgirlsschool

My First R Lesson using R Markdown

(0)
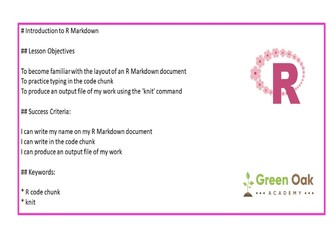
An introduction to R using R Markdown aimed at secondary school students (age 11-16) and for complete novices. A complete lesson plan to introduce the R coding language using R Markdown to deliver instructions. This lesson assumes that you have installed R Studio or have access to R Studio Cloud.
Using R to draw googlemapsQuick View
rgirlsschoolrgirlsschool

Using R to draw googlemaps

(0)
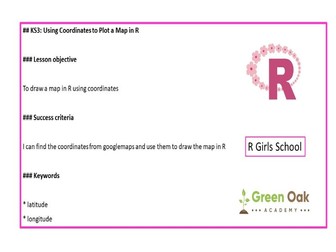
This is a fun lesson using R to draw maps based on coordinates from googlemaps. The sites selected can be changed to suit your location eg location of your school and a nearby landmark. Aimed at complete novices to R but completion of ‘My First R Lesson using R Markdown’ would be useful to gain familiarity with working in an R Markdown file. The content of the word file needs to be copied into an R Markdown file before use. This lesson assumes that you have installed RStudio or have access to RStudioCloud. If you have any queries or feedback please get back to us rgirlsschool@gmail.com