
32Uploads
241k+Views
123k+Downloads
Math
Properties of triangles
PowerPoint describes the properties of different types of triangles (including discussion of angles).
Quadrilateral properties
PowerPoint that describes the properties of different types of quadrilaterals.
Mental calculation (addition/subtraction)
Models several methods for adding/subtracting using mental strategies.
Features of graphs (including choosing graphs)
Describes different types of graphs, the fundamental features of graphs and when it is best to use certain graphs.
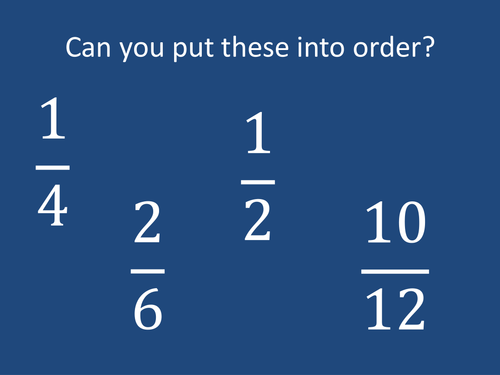
Comparing fractions
Discusses concepts of "like" and "unlike" fractions. Also, demonstrates an example method to compare fractions.
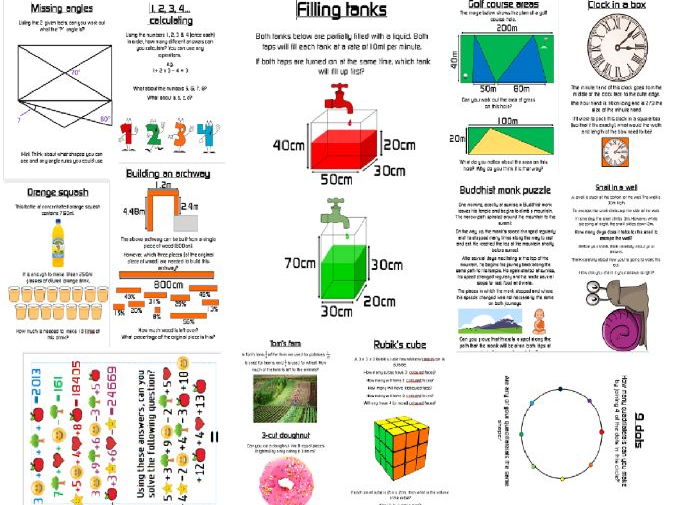
Weekly maths problems posters
Contains 21 separate low-floor, high-ceiling tasks (aimed at year 6 - but could be used for older/younger children) which can be displayed as posters in classroom.
These questions are designed so that they can be entered at a relatively low level (all should be able to access these in some way - even if it's just the initial conceptualisation of the question), but there is a large scope for extended thinking.
Note: these can seem difficult at first, but (with the right approaches) are aimed to build resilience and determination in problem solving.

Roman Statistics
A range of statistics around a Roman theme. Contains statistics on population and area data during the Roman Republic and Empire. Can be used for maths or computing activities.
Statistics have been collected from a range of sources: there may be some inaccuracies due to the long time scales.

Planetary investigation - data analysis
Includes data/information (e.g. oxygen levels, temperature, amount of vegetation/water, predators, gravity) on 6 imaginary planets - and Earth. Info on Earth is roughly accurate. This info is presented in the form of a table and as a range of graphs (e.g. pie/bar charts).
Aim of lesson is to first work out which graphs represent which planet. Children can then decided whether a planet is inhabitable (by comparing it to Earth's data).
(Includes brief lesson plan).
Adding and subtracting fractions
Models the process of adding and subtracting fractions (including pictorial representation).
Fraction - decimal relationship
PowerPoint describes the relationship between fractions and decimals (including conversion).
Plotting co-ordinates in up to the 4th quadrant
Models plotting co-ordinates in all 4 quadrants - through creating shapes.