32Uploads
238k+Views
122k+Downloads
All resources

Plotting co-ordinates in up to the 4th quadrant
Models plotting co-ordinates in all 4 quadrants - through creating shapes.

Classifying organisms
Information on different kingdoms. Focuses on different groups/classes of the animal kingdom.

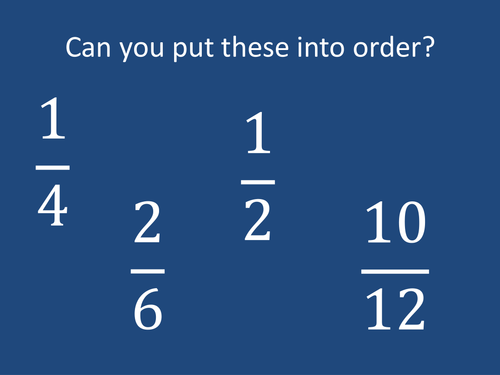
Adding and subtracting fractions
Models the process of adding and subtracting fractions (including pictorial representation).

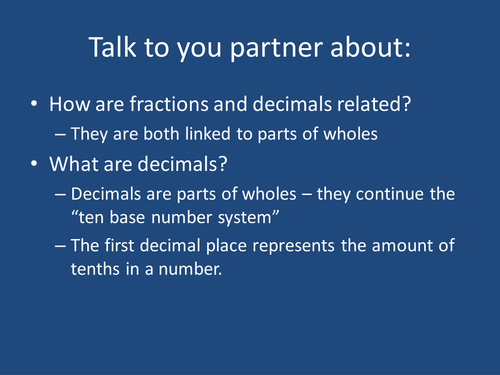
Fraction - decimal relationship
PowerPoint describes the relationship between fractions and decimals (including conversion).

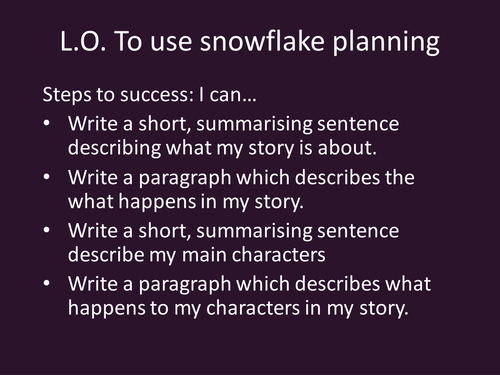
Planning for writing
Describes a unique method for planning called "Snowflake" planning. Starts with a broad summary which gets more and more specific.

Certificates
Simple certificate design. Certificates include pdf versions for easy printing off and filling in and editable word versions.
Year 6 leavers' and cross country examples included.

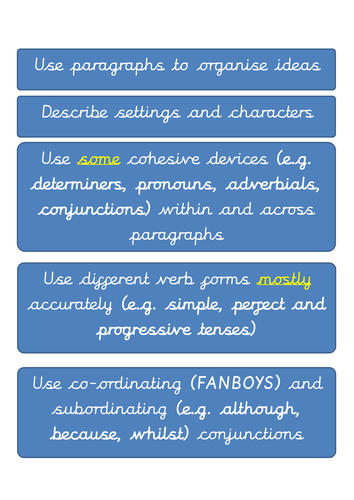
Year 6 Writing Objectives - Display
Year 6 interim writing assessment (2016-2017) statements in a clear displayable format.

Roman Statistics
A range of statistics around a Roman theme. Contains statistics on population and area data during the Roman Republic and Empire. Can be used for maths or computing activities.
Statistics have been collected from a range of sources: there may be some inaccuracies due to the long time scales.

KS2 Interim Assessment (2018) - Writing - Checklist & Objective List
Includes an editable copy of the updated 2018 interim assessment statements in the form of a checklist and a colour-coded list. Both fit on an A4 page (but could be enlarged).

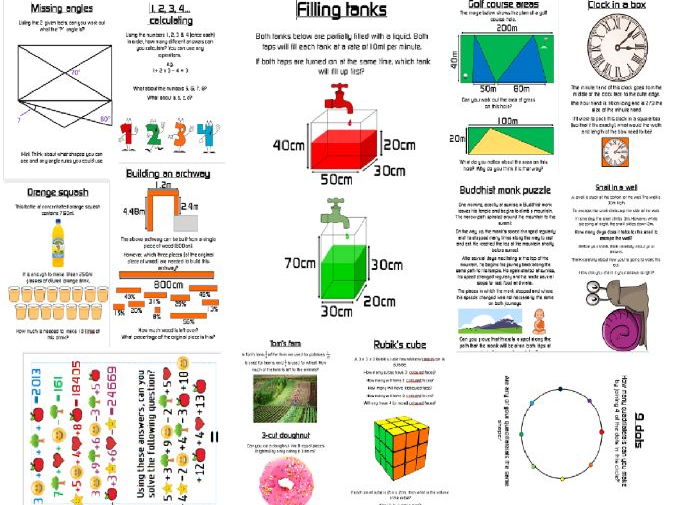
Weekly maths problems posters
Contains 21 separate low-floor, high-ceiling tasks (aimed at year 6 - but could be used for older/younger children) which can be displayed as posters in classroom.
These questions are designed so that they can be entered at a relatively low level (all should be able to access these in some way - even if it's just the initial conceptualisation of the question), but there is a large scope for extended thinking.
Note: these can seem difficult at first, but (with the right approaches) are aimed to build resilience and determination in problem solving.

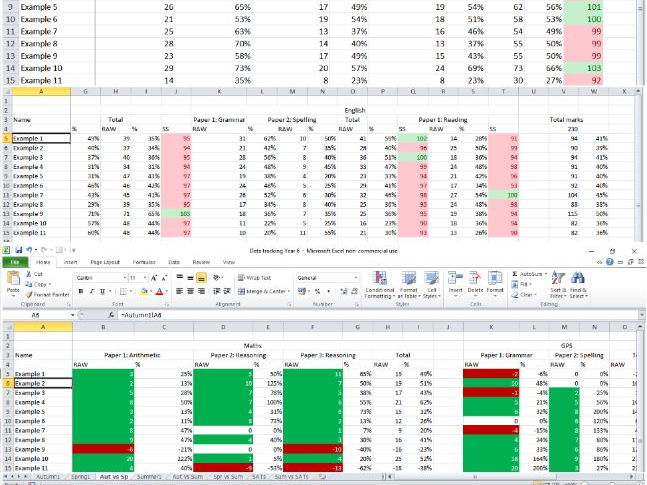
Data tracking spreadsheet
Easy to input data from SATs papers taken throughout the year (including actual SATs results). Could be adjusted for other year groups. Automatically calculates totals and percentages (based on which test has been taken). Spreadsheet also allows percentage and raw comparison between scores (to check/show progress) - this shows raw and percentage score increases. Standardised scores can also be inputted.
Spreadsheet is particularly useful in showing test progress in low scoring students.
Notes:
- Spreadsheet currently only has space for 11 names, so cells/formula will need to be extended to the desired number of names.
- When inputting names, you only need to input these into the Autumn spreadsheet (the rest will fill in automatically).
- Conditional formatting of Standardised scores is based on typical 100=EXP/110=GD boundaries
- If a child scores 0 in an earlier test, a percentage increase cannot be shown (as dividing by 0 - they will have improved their score by an infinite percentage).

British Values Posters
Contains 8 posters on British Values (including 3 title alternatives). Posters include a brief description of each value.
These posters will need trimming.

