
32Uploads
238k+Views
122k+Downloads
All resources
Cohesive devices
Describes the different types of cohesive devices. (Note: there is a lot of information on each slide).

Mental calculation (addition/subtraction)
Models several methods for adding/subtracting using mental strategies.
Properties of triangles
PowerPoint describes the properties of different types of triangles (including discussion of angles).
Quadrilateral properties
PowerPoint that describes the properties of different types of quadrilaterals.
Comparing fractions
Discusses concepts of "like" and "unlike" fractions. Also, demonstrates an example method to compare fractions.
Varying clause structures
Discusses different types of clauses and how they can be modified/added to.

Planetary investigation - data analysis
Includes data/information (e.g. oxygen levels, temperature, amount of vegetation/water, predators, gravity) on 6 imaginary planets - and Earth. Info on Earth is roughly accurate. This info is presented in the form of a table and as a range of graphs (e.g. pie/bar charts).
Aim of lesson is to first work out which graphs represent which planet. Children can then decided whether a planet is inhabitable (by comparing it to Earth's data).
(Includes brief lesson plan).
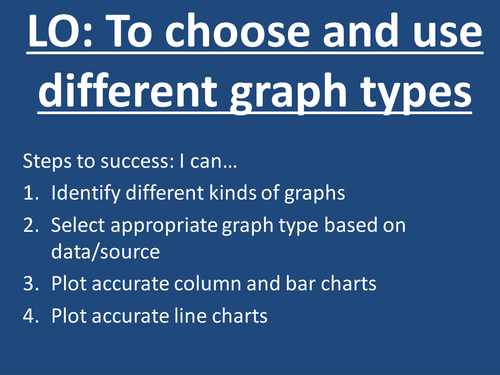
Features of graphs (including choosing graphs)
Describes different types of graphs, the fundamental features of graphs and when it is best to use certain graphs.
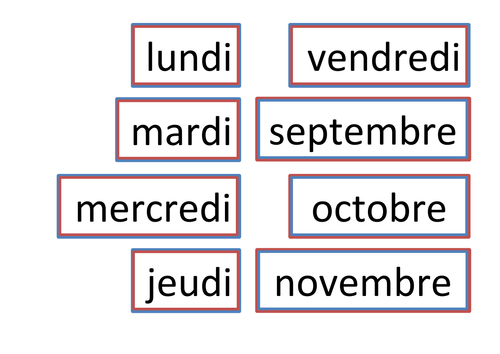
French dates
French dates (Monday - Friday, 1-31, September - August).
Useful for placing next to daily dates.