73Uploads
12k+Views
3k+Downloads
Math
Sale

Area & Perimeter of Regular & Composite Shapes
Learning Objectives:-
Calculate the perimeter of shapes
Calculate the areas of Rectangles, Triangles and Parallelograms
Calculate the areas of Trapeziums, Rhombus and Kites
Calculate the area of composite shapes
Sale

Angles & Constructions
Learning Objectives:-
Know angle types, label triangle sides and angles
Apply properties of quadrilaterals to know their names and find missing angles
Apply the properties of angles at a point, angles on a straight line, vertically opposite angles, alternate angles and corresponding angles
Use the standard ruler and compass constructions to construct a 60° angle, a perpendicular bisector, a perpendicular to a given line from/at a given point, and an angle bisector
Sale

Bearings & Maps
Learning Objectives:-
To find a bearing from A to B
To find a return bearing from B to A
To understand the points on a compass and the angles of each point
To use scale to work out distance from one bearing to another
Sale

Loci, Plans & Elevations
Learning Objectives:-
Use constructions to solve loci problems
Construct and interpret plans and elevations for 3-D shapes.
Sale

Circle Theorems
Learning Objectives: -
Apply and prove the standard circle theorems concerning angles, radii, tangents and chords, and use them to prove related results
Sale

Decimals & Standard Form
Learning Objectives:-
Understanding the place value of decimals
Multiply decimals using written methods
Divide decimals using written methods
Add and Subtract decimals using written methods
Rounding to decimal places or significant figures
Estimate Answers
Understand and use standard form for very large and very small numbers
Sale

Vectors & Transformations
Learning Objectives:-
How to generate a Vector, and Add and Subtract vectors
Consider transformations rotation, reflection, translation and enlargement (including fractional scale factors)
Sale

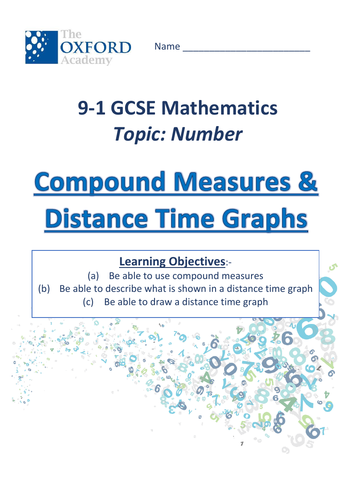
Compound Measure & Distance Time Graphs
Learning Objectives:-
(a) Be able to use compound measures
(b) Be able to describe what is shown in a distance time graph
© Be able to draw a distance time graph
Sale

Percentages
Learning Objectives:-
a) To understand how to use fractions to find percentages
b) Convert Fractions to Percentages
c) Find a percentage of an amount
d) Solve problems involving percentage increase and decrease
e) Simple and Compound Interest
Sale

Fractions
Learning Objectives:-
o Add and subtract fractions including improper fractions and mixed numbers.
o Multiply and Divide fractions
Sale

Changing the Subject, Formulae & Substitution
Learning Objectives:-
Change the subject of a formula
Write simple formulae or expressions from a problem
Substitute numerical values into formulae and expressions, including scientific formulae
Sale

Pythagoras' Theorem
Learning Objectives:-
Know and use Pythagoras’ Theorem for right-angled triangles.
Sale

Inequalities
Learning Objectives:-
Represent the solution of a linear inequality on a number line
Work out an inequality from a number line
Solving Inequalities
Sale

Straight-line Graphs
Learning Objectives:-
Be able to name and draw horizontal and vertical equations
Be able to draw an equation onto axis using the table method
Identify and interpret gradients and intercepts of linear functions, both algebraically and graphically.
Sale

Data, Charts & Diagrams
Learning Objectives:-‐
Be able to categorise different types of data,
including primary, secondary, discrete, continuous
Interpret and construct charts and diagrams
(including bar charts and pictograms) for
categorical data
Interpret and construct pie charts for categorical
data
Construct and interpret histograms with equal
class widths (for grouped discrete as well as
continuous data)
Use graphical representations to interpret,
analyse and compare the distributions of data sets
from univariate distributions (discrete, continuous
and grouped)
Sale

Ratio & Proportion
Learning Objectives:-
Relate ratios to fractions and linear functions
Divide a quantity in a given ratio
Convert standard compound units in numerical and algebraic contexts
Sale


