11Uploads
3k+Views
100Downloads
Math

Venn Diagram Generator (Geogebra)
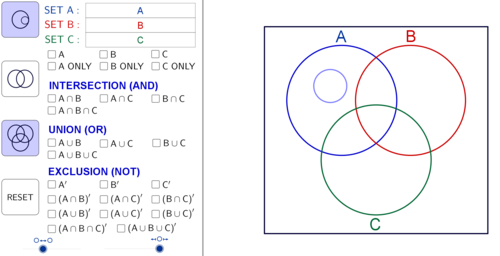
This is a Venn Diagram generator app for Geogebra v.5.0 (install version). This application will allow you to project onto a whiteboard and label two or three circle Venn diagrams.
Importantly, you can select different and/or/not logic operations and the relevant regions will be highlighted on the Venn diagram. This will help students to quickly visualise the included and excluded areas. You can also separate out the circles to show a mutually exclusive scenario.
You will enjoy the simplicity and ease of this Geogebra App. You will never need to draw Venn Diagrams on your whiteboard again.

GPS Coordinates (Geogebra)
This is a Geogebra program for use as a visual aid in the teaching of coodinates for the Global Positioning System (GPS). This program has been designed for use with Geogebra 5.0 (download version). This resource assists the teacher in clearly showing students how latitude and longitude angles are able to define any position on a 3D simulation of the Earth’s surface. Simply enter a specific GPS position (in degrees, minutes, seconds) and the program will show this location on the Earth. The program also shows a 2D represention of the position in vertical and horizontal planes, which can also be dynamically adjusted. The Earth will also spin so students can clearly identify the position from different perspectives or you can manually rotate the Earth to any perspective.
This is a resource that will visually engage your students, improve their comprehension and save you significant effort from trying to represent three dimensions on a two dimensional surface.

The Unit Circle & Periodic Functions (Geogebra)
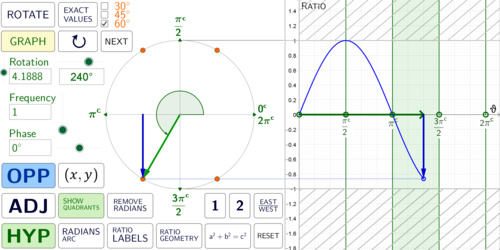
This is a Geogebra program for teaching students the Unit Circle. The program has been designed using Geogebra 5.0 (install version). This is a valuable resource when teaching trigonometry, quadrants, radians, exact ratio values, the Pythagorean identity and graphs of Sine, Cosine and Tangent. I have even included an animation of the sun rotating east to west to explain the historical reason why we rotate counter-clockwise around the unit circle for positive angles of rotation. However, you can also demonstrate negative rotation angles.
The program will show students how frequency and phase connect back to the unit circle and allows you to quickly enter specific angles of rotation for use when teaching students exact ratios. It even highlights the relevant sides of the triangle for you. The program will draw the Sine, Cosine and Tangent graphs as the point rotates around the unit circle, which allows students to see the graphs forming, creating a more engaging experience for them.
This is a visual teaching tool that will help students to better comprehend the concepts behind trigonometric ratios and their connection to the unit circle. There are many hours invested in creating this program. It has made my job as a teacher easier and I hope it does for you too. Enjoy.

The Normal Distribution (Geogebra)
This is a Geogebra (v5.0) application designed to help students understand the concepts and properties of the Normal probability distribution.
You can change the lower and upper boundaries in both the x-score and z-score forms. You can show/hide the probability between the lower and upper boundaries or reveal the left and right tail probabilities.
You can also set the mean and standard deviation to generate questions for the students to practice. Changing the standard deviation will dynamically show students how the spread of the normal distribution changes.
You can also show the points of inflection on the curve and how this is located at ±1 standard deviation.
Students will appreciate the visual engagement of the program and you, as the teacher, will appreciate the time saved in being able to quickly and clearly present solutions.

The Great Circle Distance (Geogebra)
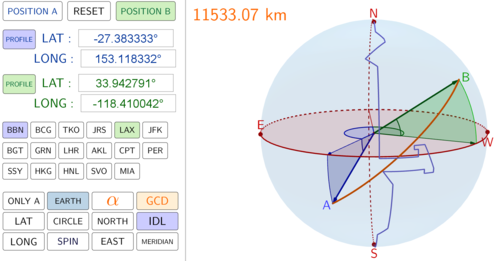
This program will show the Great Circle line between any two GPS coordinates over the surface of the Earth. It has been designed for use in Geogebra v5.0 (install version). Simply enter two GPS coordinates and the program will calculate the great circle distance and sweep angle between your two locations. You can also display a 2D circle in a 3D plane to show students how the Great Circle line wraps around the circumference of the circle.
You can highlight the latitude and longitude components of your GPS locations so that students can easily visualise how this navigation system works. Simply click on the “SPIN” button and your students will get a 360 degree view of the situation. I have also pre-programmed some GPS locations for quick access.
This is an excellent tool to help your students visualise a 3D enivronment on a 2D surface.

Integration & Area Under A Curve (Geogebra)
This is a Geogebra program for use as a visual aid when teaching how integration can be used to determine the area under a curve and the area between two curves. This program has been designed using Geogebra 5.0 (download version). The program allows you to specify two separate functions and show the definite and indefinite integral for each function. The program can also subtract the second function from the first function to determine the area enclosed by the two functions.
The teacher can also show students how the area under a curve can be approximated using the rectangle rule and trapezoidal rule for a given number of shapes. The program will represent this approximation both graphically and numerically.
This is a visually engaging resource that will quickly and professionally present solutions to area by integration type questions.

Generating Square Waves Using Harmonics (Geogebra)
This is a Geogebra program for use as a visual aid in teaching the concept of harmonics in the context of generating a square wave from sinusoidal waves. This program has been designed using Geogebra 5.0 (download version). The program will visually demonstrate how the addition of sine waves of specific amplitudes and frequencies can be added together to produce a periodic square wave signal. The specific amplitudes and frequencies on the harmonics are also displayed in a table.
This resource will visually engaged your students and give them an intuitive understanding of how a signal can be broken down into the various harmonic constituents.

Functions & Limits (Geogebra)
This is a geogebra program for use as a visual aid when teaching students about limits as a prelude to differential calculus. This program has been designed using Geogebra 5.0 (download version). You simply enter the numerator and denominator expressions of a function and specify and x limit. The program will then graph the function and display a point that represents the function value as the x values approach the specified limit. If the function is unable to be evaluated at the limit, the program will advise that the function is undefined and will show this as a hole in the graph. The program can also present a table of values as the function approaches the limit as well as any asymptote lines that exist in the function.

Venn Diagram (Geogebra)
This is a Geogebra program that is ideal for showing students how to construct and populate Venn diagrams. This program has been designed for use with Geogebra 5.0 (download version). By projecting your screen onto a whiteboard, you can easily teach students how to represent scenarios using the Venn diagram without the hassle of redrawing the diagram each time.
The program represents diagrams with either two or three circles and allows you to adjust the circle size and separation. Furthermore, it can shade regions both inside and outside of the circles to represent different logic operations. If you are tired of having to redraw your Venn diagram lines over and over, then you will love this time saving app.

Binomial & Normal Probability Distribution (Geogebra)
This is a Geogebra (v5.0) application for use as a visual aid in the teaching of binomial and normal probability distributions. This resource will display the binomial probability distribution for a given number of trials and probability of a successful outcome. You can determine the probability of an outcome, which will be displayed both numerically and graphically. Also, with the use of the animation feature teachers can demonstrate how the binomial distribution changes with a change in the number of trials or a change in the probability of a successful outcome.
The application will also allow you to superimpose a normal distribution on top the binomial distribution. This is very useful in showing students how a normal distribution can be used to approximate a binomial distribution. Students will be able to clearly visualize whether or not the normal distribution is a good approximation, as a result of the extent to which the binomial data is skewed. You can also specified lower and upper X-scores or Z-scores to determine the probability of a range of outcomes and the application will display this result both numerically and graphically. This allows the teacher to be very efficient in explaining answers to these types of questions.
Students will appreciate the visual engagement of the program and you as the teacher will appreciate the time saved in being able to quickly and clearly present solutions.

Vectors & Bearings (Geogebra)
This is a Geogebra (v5.0) application which is designed to be a resource to help students understanding the addition of two 2D navigational vectors.
The application allows the teacher to generate unlimited questions that require students to add two vectors, given magnitude and bearing, and determine the resultant vector. Also, the teacher can give students the resultant vector and ask them to calculate one of the other vectors.
The teacher can also hide or reveal a compass rose to help students convert between bearings and Cartesian angles.
This is a great visual aid for teachers to help students obtain situational awareness when resolving vectors into their component form from their navigational form.


