

130Uploads
935k+Views
1079k+Downloads
All resources
Parallel lines & angle facts quiz
20 quick questions on angles (largely) in parallel lines. Emphasis on use of correct terminology. Could be done on mini-whiteboards, or otherwise as quiz, rather than flashcards.
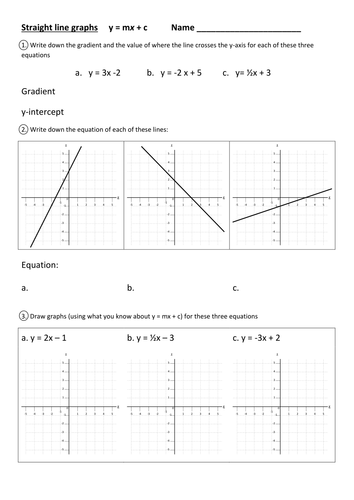
Summary worksheet for y=mx+c
Worksheet to complete topic (or as homework). Identify gradient/y-intercept from 3 equations and 3 graphs; sketch 3 graphs using y=mx+c.
Indices, powers, roots
Fairly basic set of 15 Qs to be used with flashcards, whiteboards etc. Covers integers with indices and algebraic expressions. Add/subtract rules. Useful as revision or building up to add/sub simple powers.
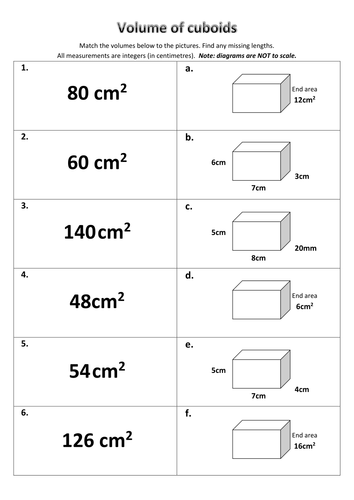
Volume of cuboids - match cards
6 pairs to match. 3 with full dimensions (one unit conversion needed). 3 with end area and missing length, but should be able to match by eliminating possibilities. Find missing dimension for last three (all integer values).
Quick starter/plenary.
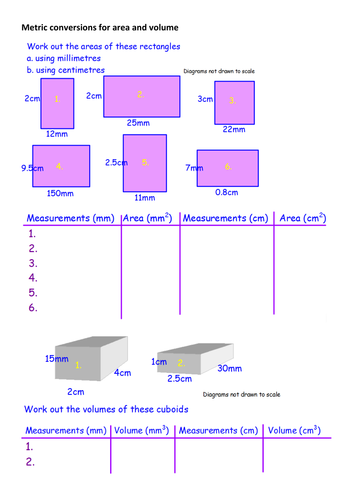
Metric conversions for area and volume
Straight-forward examples for area/volume using mixed units for length. Can they see relationship?

Perimeters of compound shapes with missing lengths
Various shapes (all but one rectilinear). All have missing lengths which need to be found. Two are in mixed units. Answers given in text box. (Delete before printing!)
Reflection and rotation symmetry
9 examples of each to show on whiteboard. Pupils write down (on personal whiteboard?) how many lines of symmetry/order of rotational symmetry. Then reveal answer on IWB. Rotations are 'animated'. Revision/plenary exercise?
Multiply fraction by a whole number
Visual demonstration/explanation of multiplying a fraction by a whole number using diagrams
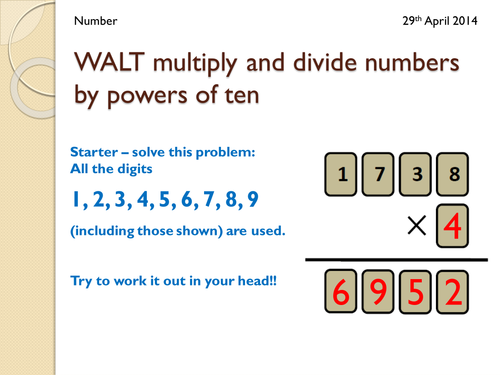
Multiplying and dividing by powers of ten
Two main slides showing visually place value adjustment when multiplying/dividing by 10, 100, 1000. Plus puzzle starter. You may just want to use the two main slides in a PowerPoint of your own!
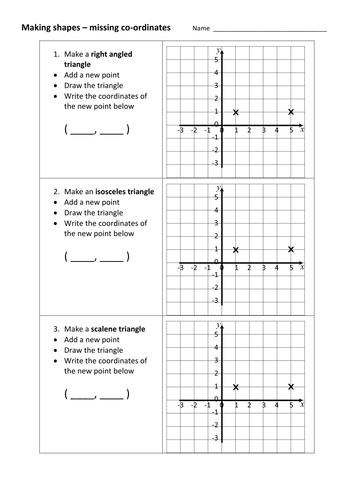
Make 2-D shapes from missing coordinates
Find the coordinates that creates the required shape - some of the problems have more than one answer. Others (assuming you use integer values and stay on the grid) do not. Various triangles, square, parallelogram, rhombus, trapezium.
Final page to identify given shapes - named, congruent, enlargement.
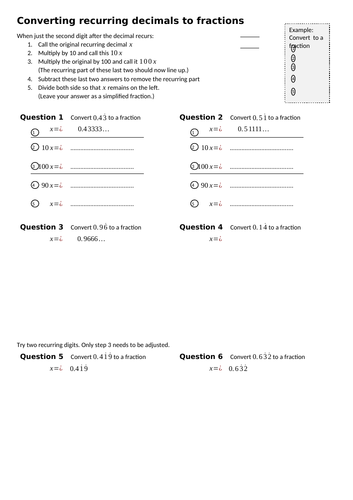
Recurring decimals to fractions - scaffolded
Scaffolded worksheet for converting decimal with second or second/third digit from decimal recurring.
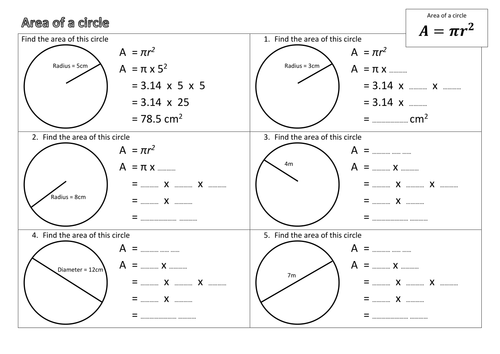
Area of circles - scaffolded worksheet
Scaffolded worksheet with 5 simple questions on area of a circle.
Types of data - discrete vs continuous
Qualitative vs quantitative, discrete vs continuous. 1. Cards to sort into two groups - may think of any way to split. 2. Flipchart to structure lesson with links to short videos etc. 3. PowerPoint quiz - identify whether discrete or continuous.

Percentage increase and decrease 'demo'
Promethean flipchart demonstrating percentage increase and decrease. Authored in ActivStudio 3.5 but should import into ActivInspire.

Maths: Percentage increase and decrease
Quick, multiple choice, summative quiz. Can use coloured flash cards or whiteboards to get responses. Reverse percentage to finish.
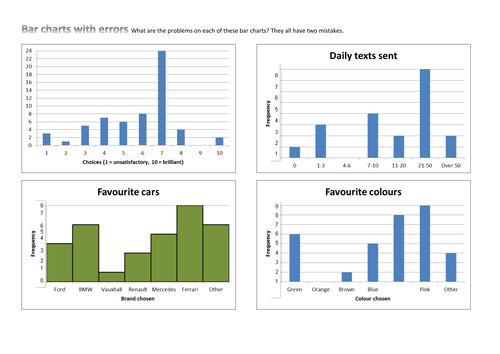

Averages from bar chart
Extract discrete data from a bar chart and use to find mean, median, mode and range. Starts by considering a table of data and then two examples of bar charts.
Mixed questions on area of basic shapes
Areas of rectangles, triangles, parallelograms and trapezia. Fairly straight-forward questions on area (or using area to find missing sides). Multichoice - so can be used with flash cards.
Circle theorems - flash card quiz
Quick 10 question quiz - identify correct theorem to use to solve problem. (No solutions required.)
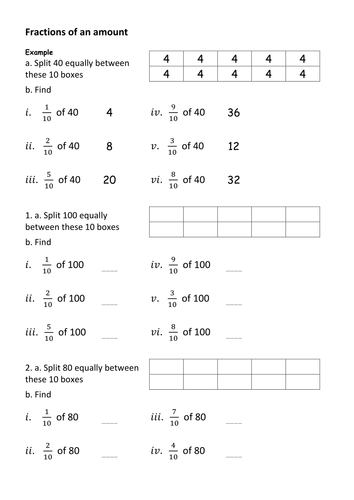
Fraction of an amount - simple
Scaffolded worksheet on fractions of an amount using fairly simple quantities.