34Uploads
42k+Views
26k+Downloads
Math

Distance Time graphs
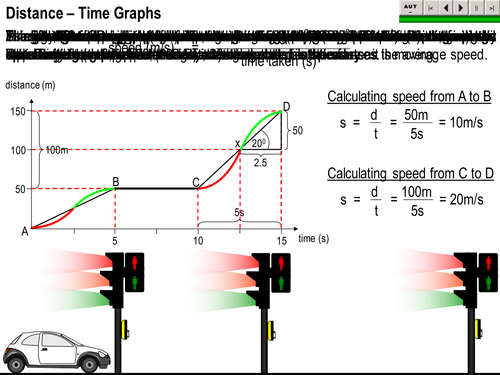
A Distance - Time graph lesson with animated sequences that demonstrates the difference between average and instantaneous speeds. During animations a bar appears under the navigation buttons that wipes across until the animation has finished; it can be paused. For the buttons to work, the macro security level has to be set to medium. This is very easy and only needs to be done once; it will not compromise your computer. Select <Tools> then <Macro> then <Security> select<Medium>. This is for ver. 2002; it might be different for later versions. COMMENTS WILL BE MUCH APPRECIATED

