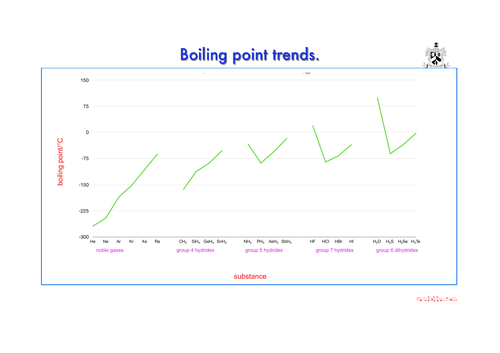
The traditional textbook graph of this data is very confused. I feel that my presentation of the data emphasizes the role played by hydrogen bonding more clearly. The influence of atomic size on boiling point is also clearly shown by the bp of the noble gases.
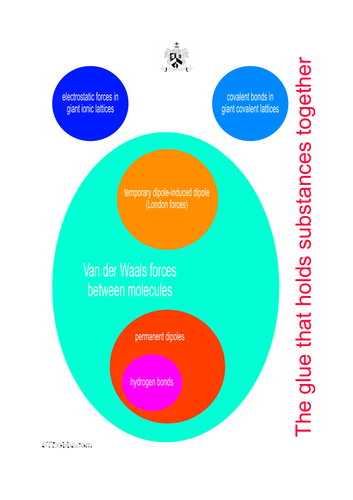
There is a beautiful graphic depicting this on the internet. However, it is a bitmapped graphic . I have adapted it as a a scalar graphic, with improvements. Please get in touch if you want an editable version.
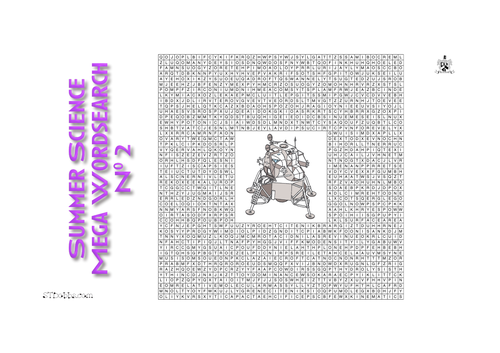
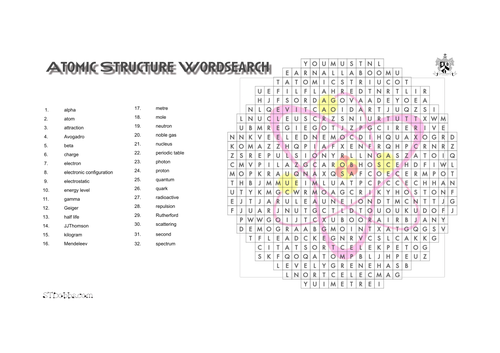
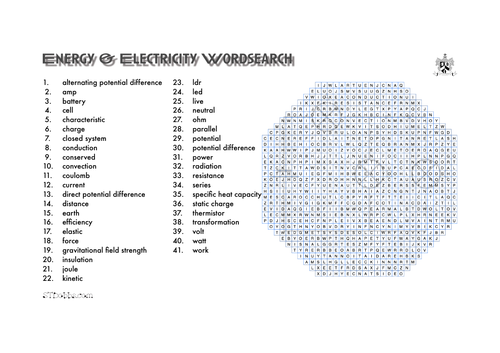
A simple wordsearch on energy & electricity.
Word searches help concentrate on scientific literacy and aid concentration. they are good summary activities and for revision. I have tried to make this attractive and efficacious in that it uses only one side of A4.
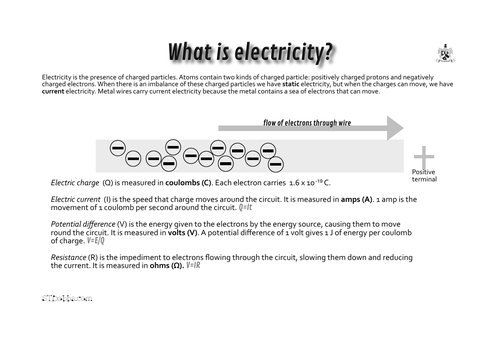
I have tried to illustrate the concept of separation of water molecules rather than breaking covalent bonds when water is heated with a quick and dirty animation. Click on the water boiling.html file and it will run in your browser.