

36Uploads
3k+Views
47Downloads
Mathematics
Sale

Percentage Powerpoint
The presentations contains 20 SLIDES:
Definition of percentage.
Where do you see percentage?
Converting Percentages into fractions, decimals and ratios.
Converting fraction to percentage.
Converting decimals to percentage.
Converting ratios to percentage.
Applications on percentages.
Percentage For comparison.
To find a given percentage of a given quantity.
To express a quantity as a percentage of another.
To find the whole using a given percentage.
Increase or decrease as percent.
Sale
Cube and Cube Roots Powerpoint
The presentation contains 82 SLIDES:
Understanding the cube.
Definition of the cube numbers.
The power notation of a cube number.
How to write and read the cube number.
Perfect Cubes from 1 to 1000.
Examples of cube numbers.
Pattern in cube numbers.
Properties of cube numbers
Numbers with their ones digit as 1 their cubes also will have the ones digit as 1.
Numbers with their ones digit as 4 or 5 their cubes also will have the ones digit as 4 or 5.
Numbers with their ones digit as 6 or 9 their cubes also will have the ones digit as 6 or 9.
Numbers with their ones digit as 0 their cubes also will have the ones digit as 0.
Numbers with their ones digit as 2 their cubes will have the ones digit as 8 and vice versa.
Numbers with their ones digit as 3 their cubes will have the ones digit as 7 and vice versa.
Examples on the above properties.
Cubes of Even numbers are Even.
Cube of Odd numbers are Odd.
Examples on the above properties.
The cube of a negative integer is negative.
Examples on the above property.
The cube of a rational number.
Examples on the above property.
Vocabulary of cube root.
The cube root symbol.
The working of a number having cube root.
Cube root for fractions.
Properties of a cube root.
Examples of a cube root.
Cube root of a negative number
Two ways to find cube roots.
Prime factorization with examples of whole number and decimal number.
Estimation with examples.
Sale

Simple Interest Powerpoint
The presentation contains 15 SLIDES:
Definition of Simple interest.
Vocabulary on different terms used in simple interest e.g. time, principal.
Formula of simple interest.
Formula of Amount.
Explanation of rate of interest with an example.
Real life problems of finding different parameters of the formula.
Sale
Circumference of a Circle Powerpoint
The presentation contains 22 SLIDES:
Definition of circumference.
The construction of formula of the circumference.
The relationship between the diameter and the radius of a circle.
Finding the circumference given the radius.
The value of π.
Examples of circumference.
Finding the radius given the circumference.
Finding the diameter given the circumference.
Find the perimeter of the given shapes.
Applications on the circumference.
Sale
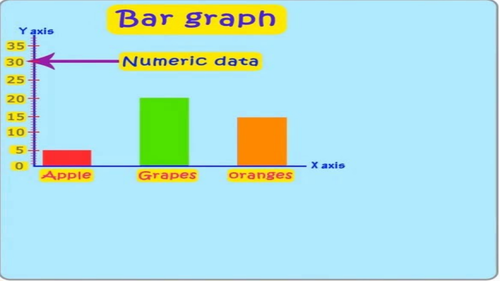
Bar Graph Powerpoint
The presentation contains 19 SLIDES:
Learning objectives.
Definition of a bar graph.
Parts of a bar graph.
Tips for construction of bar graph.
Steps to construct bar graph with an example.
Types of bar graph.
Advantages of bar graph.
Sale

Data Representation Powerpoint
The presentation contains 206 SLIDES: ( 2 COMPLETE LESSONS FREE)
TALLY MARKS
Definition of a tally mark.
Uses of tally mark.
How to count a tally mark.
Tally Mark Chart.
Construction of a tally mark table with an example.
Application on real life problems on tally mark.
Read and Interpret a tally mark table.
FREQUENCY DISTRIBUTION TABLE
Definition of a Frequency Distribution Table.
Types of Frequency Distribution Table:
a) Discrete Frequency Distribution Table (Ungrouped).
b) Continuous Frequency Distribution Table (Grouped).
Uses of Frequency Distribution Data.
5 steps to construct a Frequency Distribution Table with examples.
e.g. 1) Ungrouped Data.
2) Types of Grouped Data:
a) Continuous Interval Form (Exclusive Form).
b) Discontinuous Interval Form (Inclusive Form).
For Grouped data what are the types of class intervals
a) overlapping with example solved
b) non - overlapping with example solved.
PICTOGRAPH
Definition of a Pictograph.
Parts of a pictograph.
Tips for construction of pictograph.
Steps to construct pictograph with an example.
Scaling and drawing a pictograph.
Read and Interpret a pictograph.
BAR GRAPH
Definition of a bar graph.
Parts of a bar graph.
Tips for construction of bar graph.
Steps to construct bar graph with an example.
Types of bar graph.
Advantages of bar graph.
DOUBLE BAR GRAPH
Definition of a double bar graph.
Parts of a double bar graph.
Difference between bar graph and double bar graph.
Tips for construction of double bar graph.
Steps to construct double bar graph with an example.
To read and interpret the double bar graph.
LINE GRAPH
Definition of a line graph.
Parts of a line graph.
Tips for construction of line graph.
Steps to construct line graph with an example.
Reading and Interpreting a line graph.
Advantage of line graph.
PIE CHART
.
Definition of a Pie Chart.
Tips for construction of pie chart.
Steps to construct a pie chart with an example.
Scaling and drawing a pie chart.
Read and Interpret a pie chart.
HISTOGRAM
Definition of a Histogram.
Parts of a histogram.
Difference Between bar graph and histogram.
Types of intervals.
Tips for construction of bar graph.
Steps to construct bar graph with an example.
Read and Interpret a histogram.
DATA HANDLING
Statistics.
Fundamental Characteristics of Data.
Raw data.
Types of Data.
Data Handling Cycle.
Data Tabulation/ Recording of data .
Array with example.
Organisation of data.
Types of statistical data.
Tables e.g. Tally chart
Pictures e.g. Pictogram.
Graphs e.g. Bar graph, Pie chart, Line graph,
Diagrams e.g. Tree diagram, Venn diagram, Mapping or Arrow diagram.
Using ICT in data handling.
MEAN, MEDIAN, MODE AND RANGE
Central Tendency.
Importance of Central Tendency.
Types of measures of central tendency.
Mean and its examples.
Range and its examples.
Median and its examples.
Mode and its examples.
Sale
Area of the Circle Powerpoint
The presentations contains 21 SLIDES:
Construction of formula to find the area of circle.
Finding the area of a circle using the formula.
Finding the area given the diameter and examples.
To calculate the area of the different shapes.
Area between Two Concentric Circles.
Example on two concentric circles.
Sale
Pictograph Powerpoint
The presentation contains 15 SLIDES:
Learning Objectives.
Definition of a Pictograph.
Parts of a pictograph.
Tips for construction of pictograph.
Steps to construct pictograph with an example.
Scaling and drawing a pictograph.
Read and Interpret a pictograph