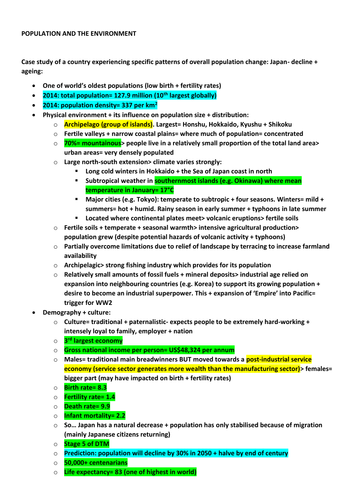
Case study of a country experiencing specific patterns of overall population change: Japan- decline + ageing
Case study of a specified local area: place, health and well-being- Hook, Hart, Hampshire
Colour coded: green statistics; yellow definitions; blue dates
Powerpoint and worksheet about the extreme temperatures, precipitation and winds around the World.
The work involves researching Case Studies from info sheets then annotating a World map with explanations for the extremes. Pupils work together, report back to other pupils then to the whole class.
Case Studies are: the Atacama Desert; Ridge A in Antarctica; Mawsynram in India; the McMurdo Dry Valleys in Antarctica; Death Valley; Barrow Island off Australia; and Vostok Station, again in Antarctica. Builds on knowledge from Hazards 1: "GLOBAL CIRCULATION SYSTEM". Enough for two lessons.
A decision making exercise (set up as a lesson) based around transnational corporations and developing countries.
How can Nigeria meet the United Nations set a Millennium Development Goal of ‘Halve the proportion of people without sustainable access to safe drinking water’?
The Nigerian Government has four options…
-Encourage the use of bottled water in partnership with a transnational company like Nestlé
-Educate Nigerian school pupils to understand the importance of water hygiene
-Form a partnership with a non-government organisation such as Water Aid
-Invest government resources into clean water supplies and sewage treatment works
Includes resources and questions
First Powerpoint in a series looking at the River Tay (Britain's largest river by discharge)
Starter: A comparison of the Tay with the Severn and the Thames and using maps to locate the Tay
Main activities: sketch of a typical river basin, then annotate to show main features (eg tributary, confluence, source, mouth)
Graphing activity to construct the long profile of the Tay (including locating the three stages of the river)
Worksheet and mystery clues comparing the Upper and Lower Stages of the Tay with Bradshaw's River Model
Differentiated questions comparing the Upper and Lower Stages of the Tay Valley
Plenary: video link recapping the long profile of a river
Eight page booklet : define tectonic keywords, complete a fact file about the Tohoku Tsunami; SPAG exercise about Japan's seismicity; empathise with a parent, a businesswoman and a farmer from Japan after the disaster; a moral dilemma about the continued use of nuclear energy; a question about God's role in natural disasters; draw your own version of The Great Wave by Hokusai
Two part fieldwork/coursework booklet
Made with the 2016 GCSE syllabus changes in mind
Follows Footsteps to Investigation (Hypothesis; Expected Outcomes; Methodology; Results; Analysis; Conclusion; Evaluation) plus the chance to write a simple risk assessment for the trip
Part One: COASTAL investigation to answer the hypothesis "Hornsea needs sea defences"
Includes destructive/constructive waves; beach cross section; annotated landscape sketch; tally chart; angle data chart
Part Two: ECONOMIC investigation to answer the hypothesis "Tourism is important for Hornsea"
Includes: Land use survey; bipolar landscape evaluation; visitor questionnaire; sphere of influence; cumulative frequency graph; bar graph; pie graph; Butler's Model
Powerpoint, worksheet and resource sheets beginning with some strange facts about the climate. Activity finding out how climate data is collected and each method's limitations. A section about climate change denial and the reasons for ignoring the scientific findings. Differentiated questions:
1-3: Choose two of the stakeholders and describe why they might say climate change is not a problem
4-6: Explain one economic reason and one social reason why some people might say climate change is not a problem
7-9: Explain the political and psychological factors which might lead to climate change denial
Links to videos which further understanding .
One page Case Studies:
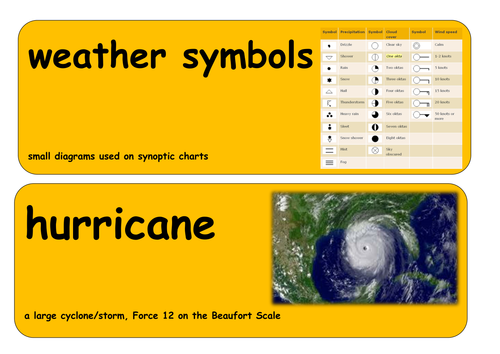
TROPICAL STORM (Hurricane Katrina)
DROUGHT (SE England, 2006)
TECTONIC HAZARD (Tohoku Tsunami, Japan)
COASTAL LANDSCAPE (Holderness, Yorkshire)
RIVER LANDSCAPE (Tay Valley, Scotland)
SUSTAINABLE RAINFOREST (B&Q timber policy in the Amazon)
SUSTAINABLE ARCTIC (Svalbard Environmental Protection Act , Norway)
ARCTIC TREATY (The Arctic Council)
CITY IN AN ADVANCED COUNTRY (Hull, Yorkshire)
CITY IN A DEVELOPING COUNTRY (La Paz, Bolivia)
LIDC DEVELOPMENT (Top down and bottom up development, Nigeria)
UK ECONOMIC HUB (The Cambridge Cluster)
UK’S POLITICAL ROLE (Iraq War, 2003)
ETHNIC FOOD IN THE UK (origins of fish & chips and curry)
UK FOOD SECURITY (LOCAL) food banks
UK FOOD SECURITY (PAST) factory farmed chicken
UK FOOD SECURITY (PRESENT) GM crops
Glossary of key words
Geography Case Study
Lithium is key to green technologies.
The “Lithium Triangle” of Argentina, Bolivia and Chile, holds most of the world’s lithium reserves.
Chinese businesses face allegations of the violation of the rights of local communities, damage to ecosystems and unsafe working conditions.
Argentinian lithium miners surrounded their Chinese managers’ compound and blockaded the entrance with flaming tyres.
This resource includes a variety of lesson activities to pick and choose:
Which Geography keyword is the ODD ONE OUT?
5Ws &1H about Tesla Motors and Elon Musk
5Ws &1H about a photo of lithium salt mounds
In which photo would you be most likely to … meet a worker whose health is at risk?
Critical Thinking: write THREE sentences to LINK these four images (technology: manufacturing, sales, use, waste)
Worksheet and data to construct a dot distribution map of China’s lithium mines around the World
PQE: China’s Lithium Mines - worksheet to analyse the dot distribution map using critical thinking (Patterns, Quantify, Exceptions)
Several slides for screen projection: encourages class evaluation of the positives vs negatives of dot distribution
Slide showing annotated map of Global North vs Global South - encourages analysis of correlation between lithium mining and socio-economic development
Link to video: “Argentina indigenous groups
protest against lithium mining”
Concept Map: The Lithium Triangle (35 snippets of info, to be colour-coded according to Locations, Causes, Effects, Management, Supporting Data)
The concept map info can then be used for:
Thought Chains: The Lithium Triangle - complete the scaffolding to complete six pieces of analysis…
“Chinese firms have been buying lithium mines in South America because…”
“The lithium mining industry in South America is SOCIALLY unsustainable because…”
“The lithium mining industry in South America is ECONOMICALLY unsustainable because…”
“The lithium mining industry in South America is ENVIRONMENTALLY unsustainable because…”
“Electric car makers buy Chinese lithium-ion batteries because…”
“Electric cars are not yet completely sustainable because…”
Geography Web: The Lithium Triangle
Pupils link feature and analyse the connections between the Lithium Triangle and China, Argentina’s government, indigenous people, Tesla Motors
TEACHERS’ BACKGROUND INFORMATION sheets (x3) with links to relevant articles and original BBC News story
Geography Case Study
April - May, 2024
Meteorologists confirmed that Hidaya is the strongest tropical cyclone ever observed in this part of the south Indian Ocean
Floods in Kenya killed 257 and injured 188 people; 56,000 homes destroyed
Activities concentrate on the Mukuru slum in the south of Nairobi
Flooding made worse by: Nairobi built on flood plain by the British colonisers + climate change + Indian Ocean Dipole + informal housing along river banks + saturated soil + impermeable concrete + infilling of Nairobi Dam
5Ws &1H: satellite photo of Tropical Cyclone Hidaya
Which settlement type is the ODD ONE OUT?
Which weather event is the ODD ONE OUT?
Lateral Thinking about the KENYAN FLOODS: Write three geographical sentences linking four photographs
Which photograph shows Kenya? Write a sentence to explain reasoning. (Actually a trick question: They ALL show different aspects of Kenya)
Over a dozen slides to set the scene and prompt discussion: photos of Nairobi and Mukuru, graph showing precipitation (to spot the two rainy seasons)
Links to videos for further knowledge
Mystery: Why did the Mwangi family have to leave their home?
Two slides of clues to help solve the mystery
Worksheet: annotate the map of Nairobi to explain the causes of the floods
Concept hexagons: explain the links between the icons (people, housing, cyclone, rain, flood, death)
Worksheet: Conclusion - Hypothesis “The Kenyan government were right to demolish the houses in Mukuru”
TEACHERS’ BACKGROUND INFORMATION sheets (x2) with further links and detail
Geography Case Study
We are meant to eat our Five a Day.
The UK only produces 17% of the fruit
and 55% of the vegetables that are bought in British shops.
40% of UK food is produced abroad.
Between 2023 and 2024, the Trussell Trust food banks distributed three million food parcels
to British people.
So what is going on?
This resource includes a variety of lesson activities to pick and choose:
Which Geography keyword (farming types) is the odd one out?
Which grass (cereals) is the odd one out?
In which photo of farming are you most likely to see agrichemicals being used? (vs Golden Rice).
%Ws & 1H - Battery hens (for class discussion).
Comparison of farming today with a 14th c. illustration.
Link to Channel 4 News video: ‘Millions in UK need to double income to escape poverty’.
Lateral Thinking about food supplies - ‘Discuss how these four photographs are linked… Then write three sentences to explain your ideas’ (climate change, floods, empty shekves, container ship).
Development compass worksheet: ‘Food security’.
Info sheet: ‘UK Food Security’ - to help complete…
Question Grid: ‘UK Food Security’.
Role play group sheets:
HM Government
UK farmers
Egyptian farmers
UK families
UK supermarkets
UK food bank organisers
Each sheet has some background info, two possible questions and space for students’ own questions to prepare before the role play itself.
Stakeholders’ conclusions: Worksheet folowing the role play
Worksheet: complete a divided bar graph showing ‘UK Food Imports’. Then students read the text, highlighting the main reasons why the UK’s food security is a problem.
Finally, they write a conclusion to explain what they have learned about the UK’s food security.
Worksheet: ‘Geo-Hexagons: Food Security’ - war, climate, money, Europe, inflation, shopping. Students explain in detail how each image is linked geographically.
Worksheet - Living Graph: ‘UK Households Experiencing Food Insecurity’ (with 20 clues to choose from).
Point, Evidence, Explanation, Link activity - ’ Food Imports to the UK’ (info sheet including proportional area map, worksheet to complete bar graph showing origin of foodstuffs, PEEL worksheet to complete).
Worksheet - ‘True for who? UK Food Security’
Worksheet - deBono’s ‘Six Hats: Food Security in the UK’.
Worksheet - ‘Thought Chains: Food Security in the UK’. Activity trains students to analyse data in detail using connectives. (Imports, sustainability, food bank use in the UK).
Food Security mystery: ‘Why are UK food prices so high?’
32 clues to distribute amongst students. Includes Ukraine War, changing diets, inflation, food waste).
Worksheet - ‘Geography Web: Food Security in the UK’.
Part filled-in to show how students should complete the activity. Links to be made between: Food supplies, the UK, Ukraine, Russia, migrant workers, petrochemicals).
Teachers’ Background Information: Includes links to original BBC article, academic articles.
Eight page booklet : define Geographical keywords; map the main national religions of the Middle East; SPAG exercise about the earliest civilisations; complete a multiplier effect of the oil industry; moral dilemma about letting refugees come to Britain; research the family tree of religions to find their founding dates; describe the importance of four Middle Eastern locations to religious people
Eight page booklet : define Geographical keywords; complete a fact file about a an Indian state; SPAG exercise about Indian food; annotate a photo to show the problems of slum life; moral dilemma comparing the lives of the super rich and the extreme poor; explain why trees are important in Geography (using a Hindu quote as a prompt); a comparison of the lives of Krishna and Jesus
Powerpoint inspired by the RGS scheme of work "China Today". Whole lesson, includes starter (multinational companies), comparison of Shenzhen in 1970 with today, Geographical mystery about Apple's involvement ion China (WHAT were the reasons for moving iPhone production to China? HOW were the Foxconn workers treated? WHY are there nets outside Foxconn factory windows? WHO benefits from Apple products being made in China? ), differentiated questions (Explain why Apple was so interested in making its products in China; Compare the opinions of a Foxconn worker in China with an Apple customer in the UK. Then give your opinion of Foxconn/Apple; Describe the living and working conditions inside a Chinese factory like Foxconn) and plenary (the suicide of Ma Xiang Qian )
Powerpoint comparing the UK's development with Nigeria as a starter, The main part looks at how oil has brought wealth to Nigeria (eg Eko Atlantic City) but also devestation to the peoples of the Niger Delta. Plenary compares MNCs with the GDP of various countries. Activities include a mystery exercise and an exam-style question... HYPOTHESIS: “The discovery of crude oil in 1956 has helped Nigeria to develop”
Eight page booklet : define keywords, Latitude/Longitude map skills, a SPAG exercise about Russia, space for pupils to analyse Russia's citizenship policy, a moral dilemma based on renewing the UK's nuclear weapons, a page to write about the pupil's photo of Russia and finally a chance to research and design a Russian doll
Series of Powerpoints and worksheets...
1: "We need rivers" (map and atlas skills (locating World rivers); photo analysis of human uses of rivers)
2: "The start(s) of the Nile" (carousel activities looking at upper course features)
3: "Khartoum" (climate graphs; satellite photo analysis; map annotation assessment)
4: "Egypt, Gift of the Nile" (Egyptian mythology; use info sheets to complete a sheet linking the annual flood to Egypt's wealth, farming, transport, etc)
5: "Aswan Dam" (make a long profile of the Nile; pupils debate the advantages and disadvantages of the dam then write a conclusion)
6: "Stream table" (erosion, transportation, deposition starter; class activity recording features seen while changing slope and water flow)
7: "Waterfalls" (rock types as a starter; stream table experiment to make waterfalls; record results by annotating diagrams)
If you like these resources, give me a rating/comment and then take a look at my shop
(* Pompey Rich *)