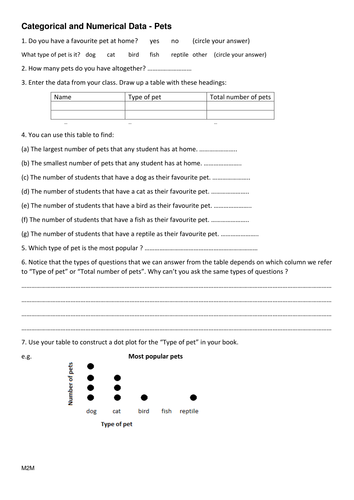
A double sided worksheet with solutions. Students need to gather data on pet ownership from the class. This data is then organised into a table. The students then use the data to answer questions and are able to distinguish between the categorical and numerical data gathered. Dot and column graphs are used to show data.
Worksheet could be used as a lesson to show students the difference between these two types of data.
(Australian Curriculum) NSW MA3-18SP uses appropriate methods to collect data and constructs, interprets and evaluates data displays, including dot plots, line graphs and two-way tables
Worksheet could be used as a lesson to show students the difference between these two types of data.
(Australian Curriculum) NSW MA3-18SP uses appropriate methods to collect data and constructs, interprets and evaluates data displays, including dot plots, line graphs and two-way tables
Something went wrong, please try again later.
This resource hasn't been reviewed yet
To ensure quality for our reviews, only customers who have purchased this resource can review it
Report this resourceto let us know if it violates our terms and conditions.
Our customer service team will review your report and will be in touch.
£3.00
