130Uploads
931k+Views
1075k+Downloads
All resources

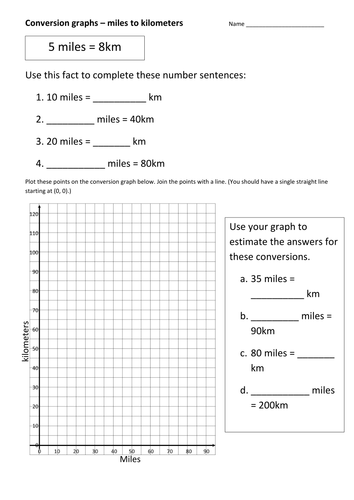
Draw and interpret conversion graph - miles to km
Scaffolded worksheet asking students to find 4 points, plot these on a conversion graph of miles to km and then use the line to convert 4 other values. (10/2/14) Two further examples added.

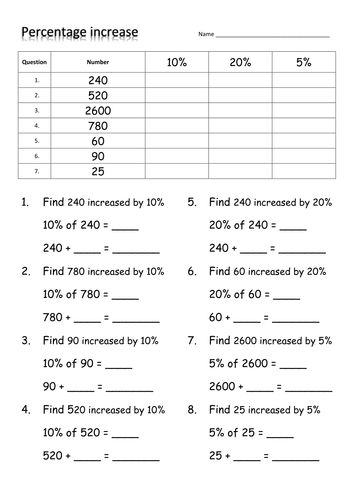
Percentage increase - scaffolded worksheet
First find 10, 20 and 5% of some numbers. Then questions using these values. Finally questions with other values and with guidance on how to get the correct amount. Could be calculator, but sums should be easy enough without.
[3/2/16 Second version added for pupils who need further practice. 12/7/16 Answers uploaded]

Types of data - discrete vs continuous
Qualitative vs quantitative, discrete vs continuous. 1. Cards to sort into two groups - may think of any way to split. 2. Flipchart to structure lesson with links to short videos etc. 3. PowerPoint quiz - identify whether discrete or continuous.

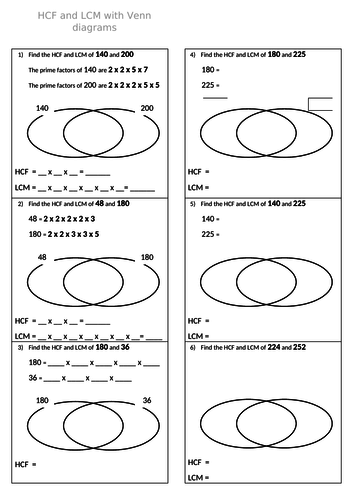
HCF and LCM using Venn diagrams - scaffolded
Assumes learners know how to find prime factors (using factor trees etc.). First question laid out to “fill in”. Subsequent questions have less structure as worksheet progresses.


