Hero image

Resources by mrskidson14

Average Rating4.67
(based on 64 reviews)

I have been teaching mathematics and psychology for 5 and a half years and am now on maternity leave with my first child. I am therefore deciding to share some of the resources I have created over the years and found most useful! There are lesson planning resources, classroom displays, whole lessons, festive activities, revision tasks and more.

20Uploads

30k+Views

11k+Downloads

I have been teaching mathematics and psychology for 5 and a half years and am now on maternity leave with my first child. I am therefore deciding to share some of the resources I have created over the years and found most useful! There are lesson planning resources, classroom displays, whole lessons, festive activities, revision tasks and more.
3D Drawing - Lego Movie - Isometric Paper - Plans and Elevations
mrskidson14mrskidson14

3D Drawing - Lego Movie - Isometric Paper - Plans and Elevations

(0)
I have used this lesson every year since I began teaching and it’s a winner! Students get to practise isometric drawing and drawing plans and elevations of 3D shapes. It is based on The Lego Movie and requires students to have access to little cubes they can fix together, e.g. mathlink or snap cubes. I use miniature cubes which work well. There is a competitive, game element to the lesson which encourages team work and motivates students!
Choosing a Stats Test - Interactive Flowchart (Psychology)
mrskidson14mrskidson14

Choosing a Stats Test - Interactive Flowchart (Psychology)

(0)
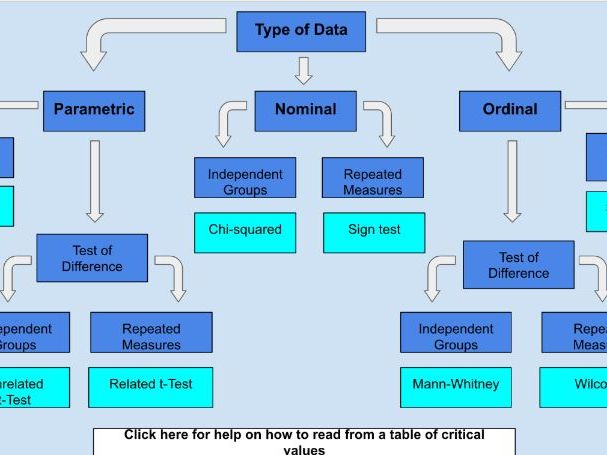
This interactive flowchart helps you decide which statistics test to perform based on the type of data you have and what you are looking for. If you click on each of the categories it brings up a help bubble with a descriptor of what it means. If you click on each statistical test it brings up a complete worked example of how to perform that test. It also includes a help sheet and example questions on reading from a table of critical values. My students have found this invaluable in helping them navigate which test to use, but also as a visual display to aid their memory.
Data Handling Project Yr 7/8
mrskidson14mrskidson14

Data Handling Project Yr 7/8

(0)
This set of lessons walks students through creating a testable hypothesis and collecting data on reaction times. I have then included some examples of how this data could be represented in bar charts, pie charts, scatter graphs and line graphs. The pupils are then guided through creating their own poster presentation and instructions are given for peer marking.
Loci - An active lesson to help students understand how to draw a locus
mrskidson14mrskidson14

Loci - An active lesson to help students understand how to draw a locus

(0)
This lesson contains guided instructions for an outdoor activity based around 4 main loci. The powerpoint then guides students through how to construct these loci with a pair of compasses. A worksheet is included for pupils to practise these skills There is a further extension where students have to construct several loci to cross a room without intercepting the lasers.
Introduction to Solving Equations
mrskidson14mrskidson14

Introduction to Solving Equations

(0)
This resource walks students through the first steps needed to solve an equation. They will already need to have a basic understanding of algebraic expressions and “I’m thinking of a number…” problems. I have tried many different ways of introducing algebra to year 7s and I find this combination of techniques works where others have limitations. I encounter far fewer stumbling blocks when making the jump to more challenging equations. Some techniques involved include: I’m thinking of a number, balancing method and gobstopper method.
Graph Transformations - discovery based lesson
mrskidson14mrskidson14

Graph Transformations - discovery based lesson

(0)
This slideshow can be used either as whole-class teaching or as student-led discovery. I would recommend using graphing software such as Desmos or Geogebra to allow students to discover the transformations, led by the prompts in the slideshow. There are also blank spaces to draw on the correct graphs on a whiteboard. This slideshow contains AfL questions which would be ideal for mini whiteboards And finally there are exam style questions with answers at the end so students can put this skill into practice.
Choosing the Best Average
mrskidson14mrskidson14

Choosing the Best Average

(0)
A slideshow guiding students to question the limitations of using the mode, median and mean, using real life examples. Questions for whole-class discussion, a table of pros and cons of each average and an activity for them to practise.
Graphs of Trigonometric Functions - using the symmetry of trig curves
mrskidson14mrskidson14

Graphs of Trigonometric Functions - using the symmetry of trig curves

(0)
This lesson is suitable for a top GCSE class or A Level students. It explores the symmetry of trig curves. The lesson includes an initial introduction to the symmetry of the sine curve and then some AfL questions, before providing multiple questions and answers for students to check their work. It also includes some extension questions to stretch those most able, including working with surds.
Problem Solving Toolkit - classroom display
mrskidson14mrskidson14

Problem Solving Toolkit - classroom display

(0)
This classroom display encourages students to ask themselves questions when trying to solve a challenging problem. For example: “can I find a right-angled triangle?” or "can I use a letter to represent an unknown?" It tries to go beyond the generic “can I draw a picture” questions normally used for problem solving and focuses on specific methods necessary for the more challenging questions of the new GCSE.
Festive Fractions!
mrskidson14mrskidson14

Festive Fractions!

(0)
A creative activity for the festive season, that still revolves around mathematics! It uses basic algebraic rules to simplify fractions, but only using pictures. Skills involved: multiplying fractions, dividing fractions, simplifying fractions, algebraic notation Happy puzzling!
KS3 / KS4 Data Collection Summer Investigation
mrskidson14mrskidson14

KS3 / KS4 Data Collection Summer Investigation

(1)
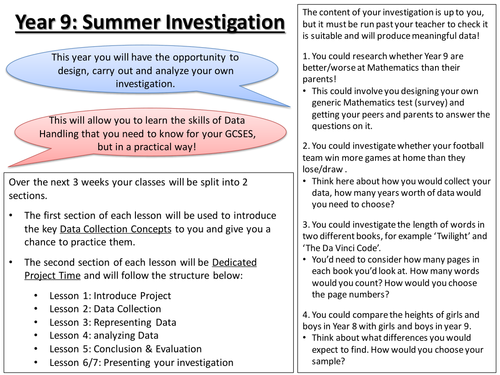
This is a 6/7 week lesson plan for Year 9s to carry out an investigation whilst still being taught the Data Collection Topics they need to know. Each lesson is split into 2 sections: Introduction of Concept and Application of Concept. Either the pupils can choose different tasks in groups or the whole class can work on one big project. The project culminates in an A3 poster depicting their work and a group presentation which is peer-reviewed.